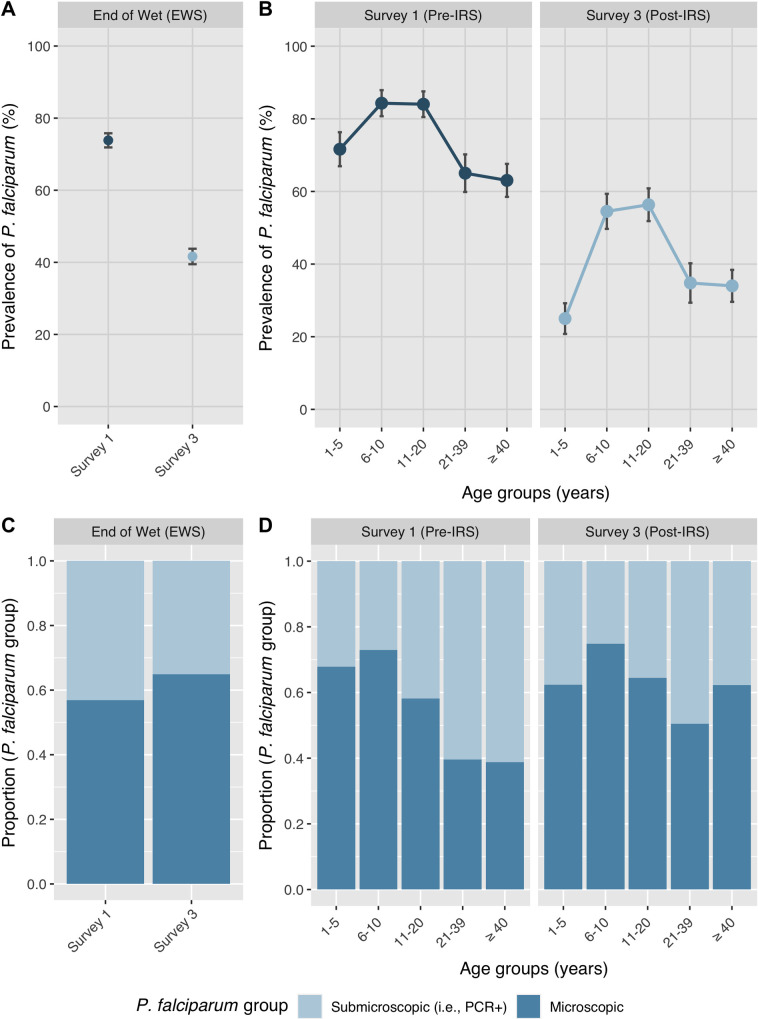
Fig 4. Reductions in the prevalence of microscopic and submicroscopic P. falciparum infections at the end of the wet seasons (i.e., Survey 1 and Survey 3) pre- and post-IRS.
Prevalence of P. falciparum infections A. at the end of the wet seasons and B. across each age group (years) at the wet seasons pre- and post-IRS. Error bars represent the upper and lower limits of the 95% confidence interval (CI). Proportion of microscopic and submicroscopic P. falciparum infections at the C. at the end of the wet seasons and D. across each age group (years) at the end of the wet season pre- and post-IRS. Light blue bars indicate the proportion of individuals with submicroscopic P. falciparum infections detected using the 18S rRNA PCR; while dark blue bars indicate the proportion of individuals with microscopically detectable P. falciparum infections. For additional details see S4 Table.

