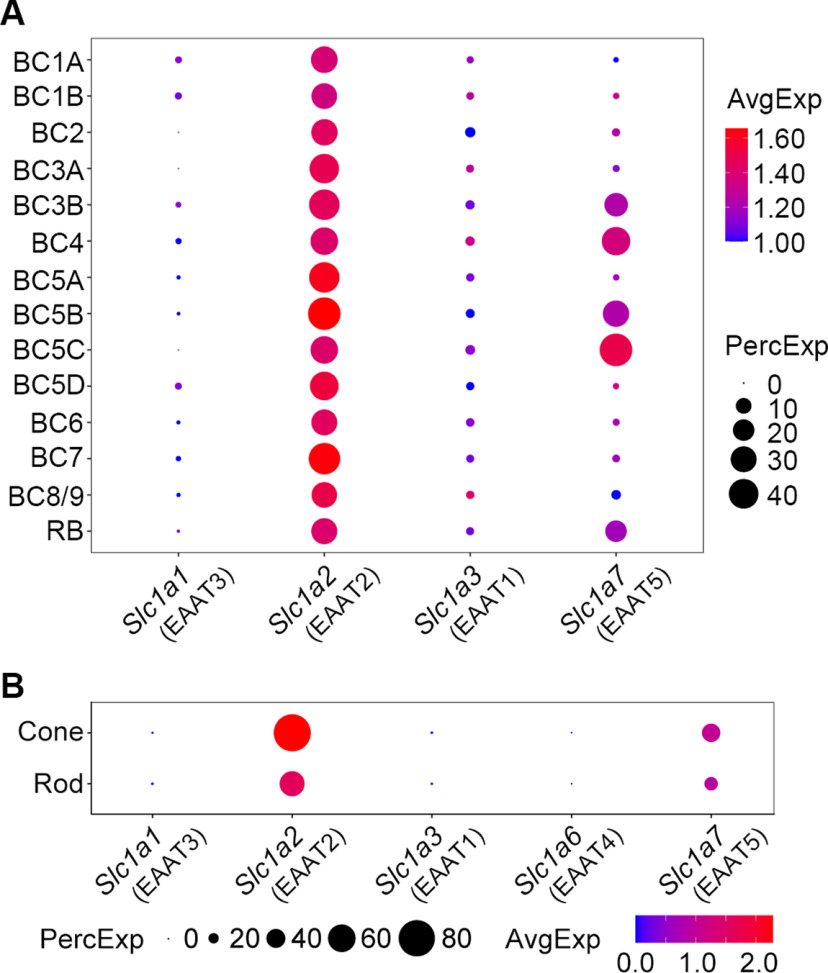
Figure 1.
scRNA-seq data analysis reveals gene expression of EAAT2 in all mouse retinal BCs and co-expression with EAAT5 in several BC types. A, Gene expression patterns of EAATs in different types of BCs. The protein that each gene encodes is given in parentheses. The size of each circle represents the percentage of cells in the group (PercExp) in which the gene expression is detected. The color represents the average transcript count in expressing cells (AvgExp). BC, bipolar cell; RB, rod bipolar cell. B, Co-expression of EAAT2 and EAAT5 in cone and rod photoreceptors.

