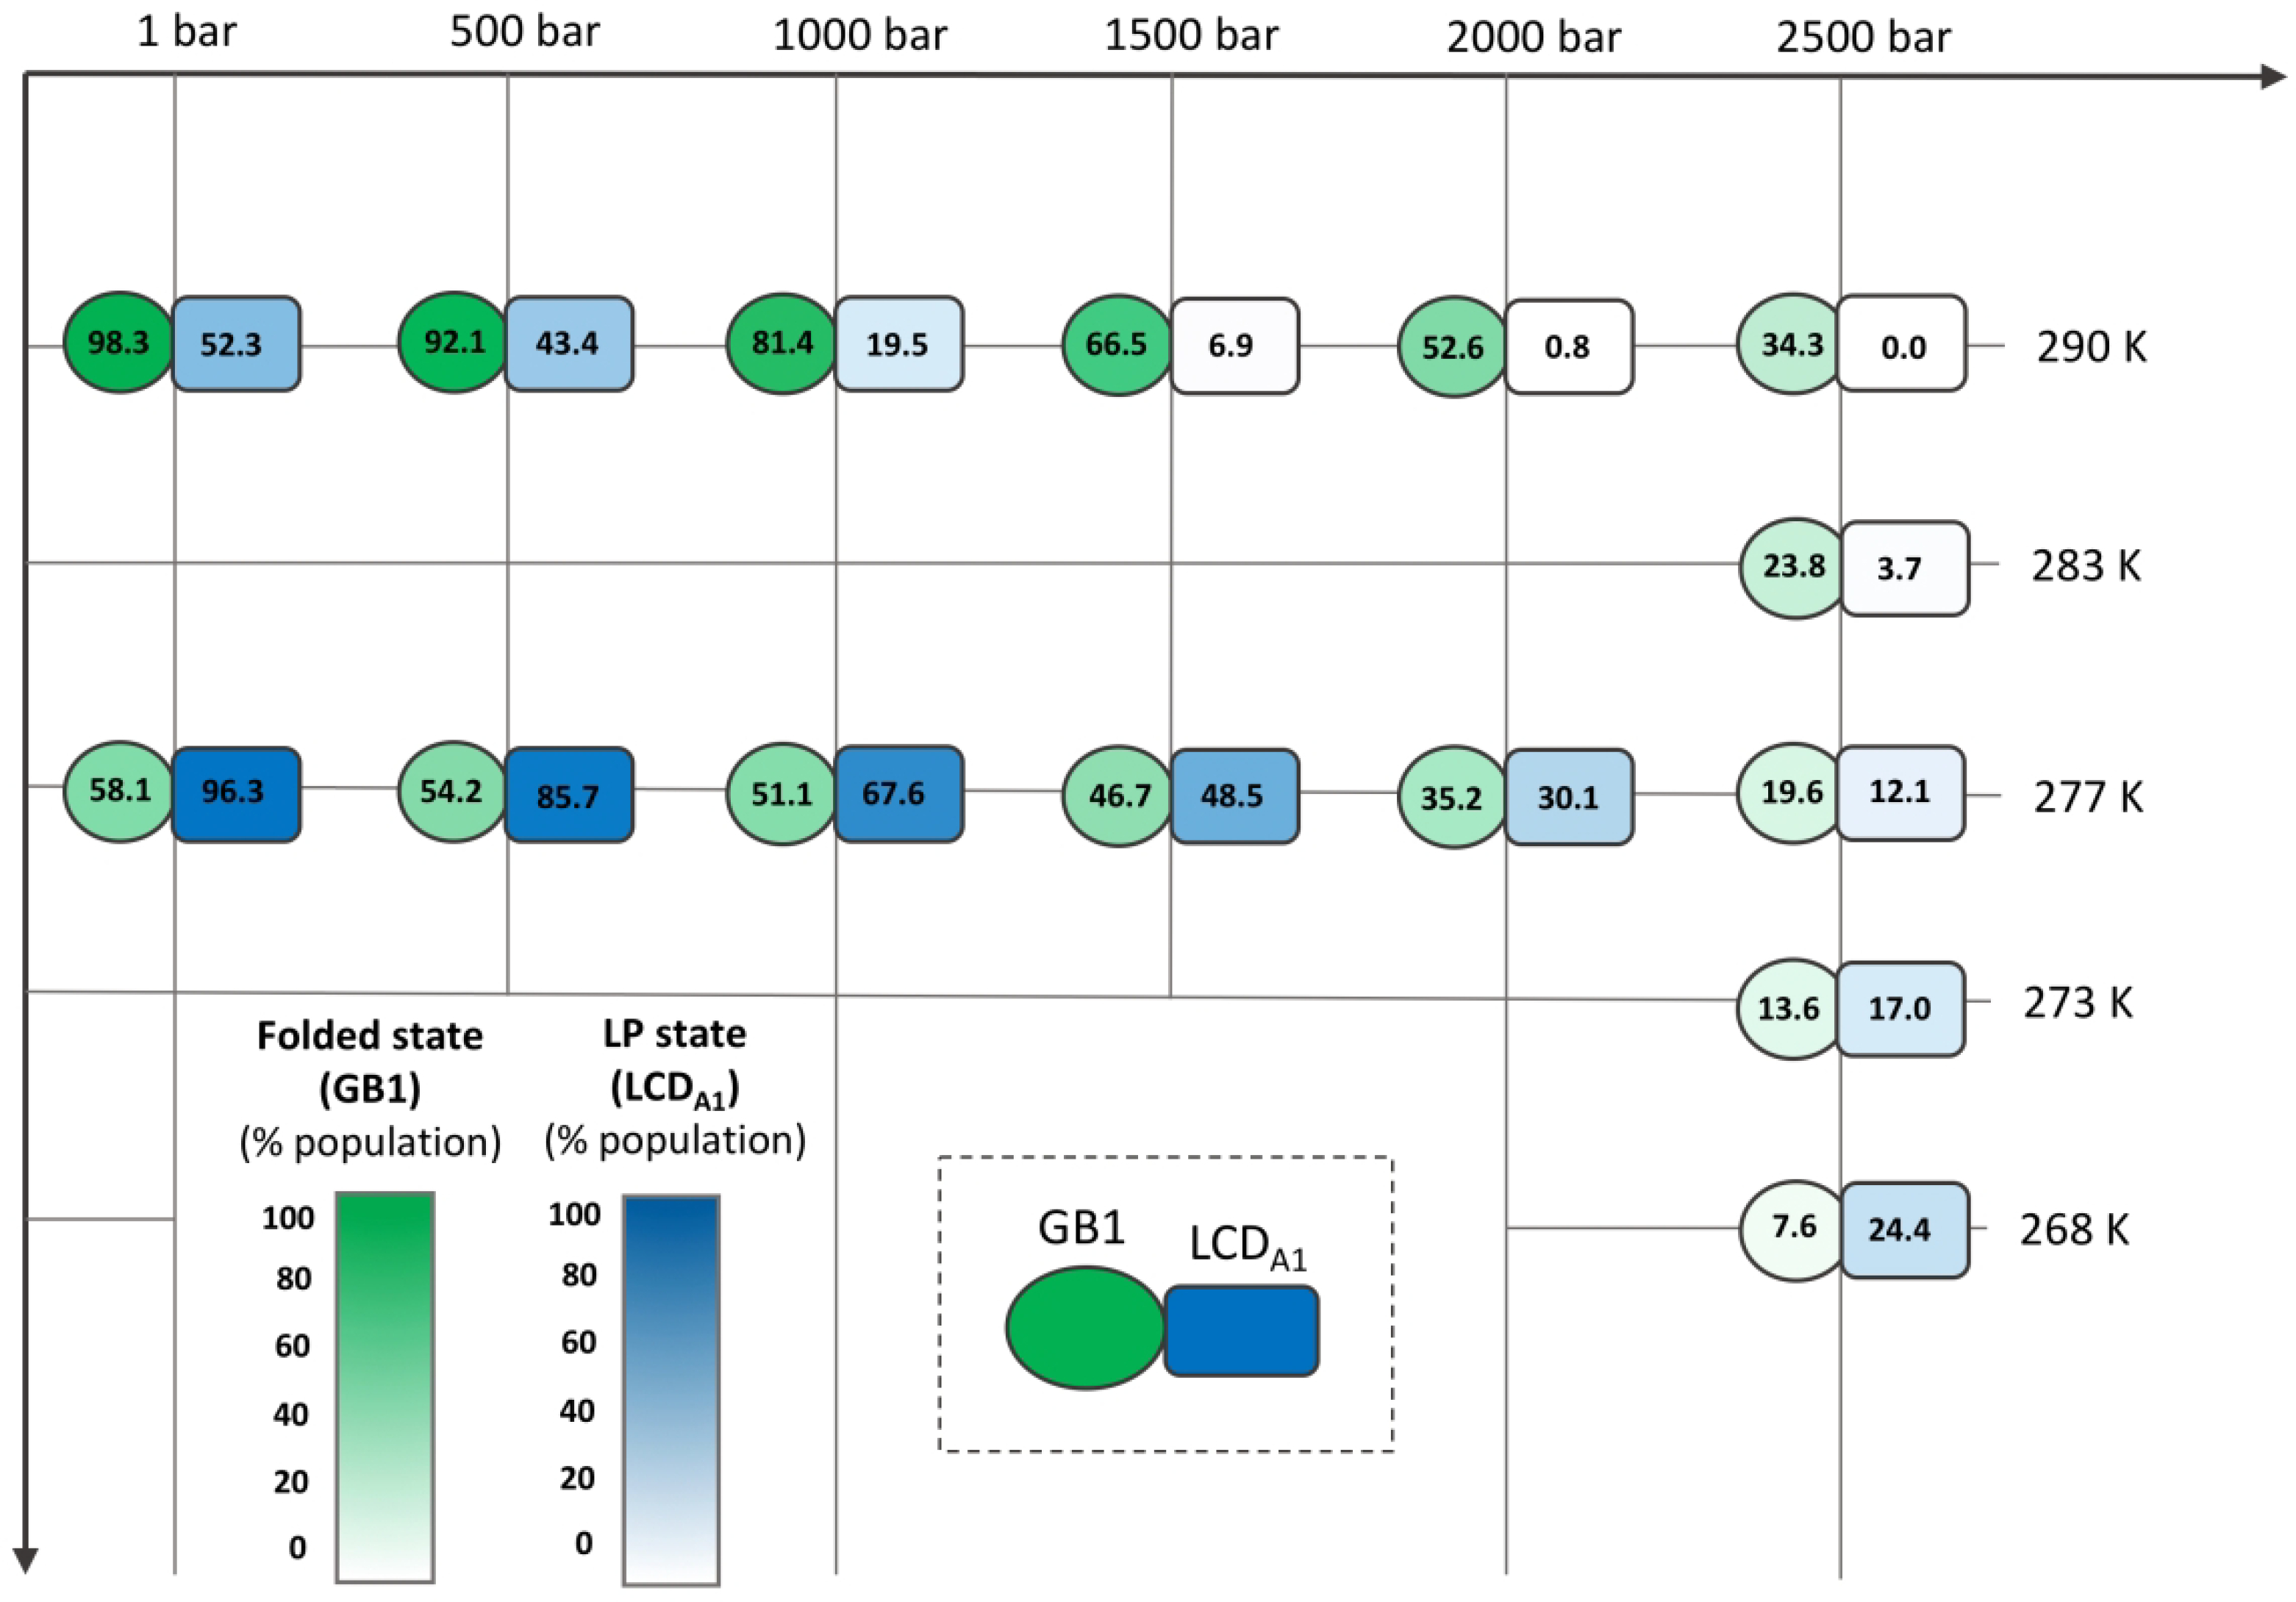
Figure 5.

Pressure-temperature mapping of the relative folded population of GB1 in GB1-LCDA1 (green circle) and relative LP population of LCDA1 in GB1-LCDA1. The theoretical maxima (100%) were calculated for both GB1 folded state LCDA1 LP state from the fit of the pressure denaturation profiles (see Fig. 3 C and D for GB1 and Fig. 3 A and B for LCDA1) using equation (3) (i.e. IF in equation (3)). Numbers shown here correspond to the average of the relative population calculated over all individual crosspeaks.
