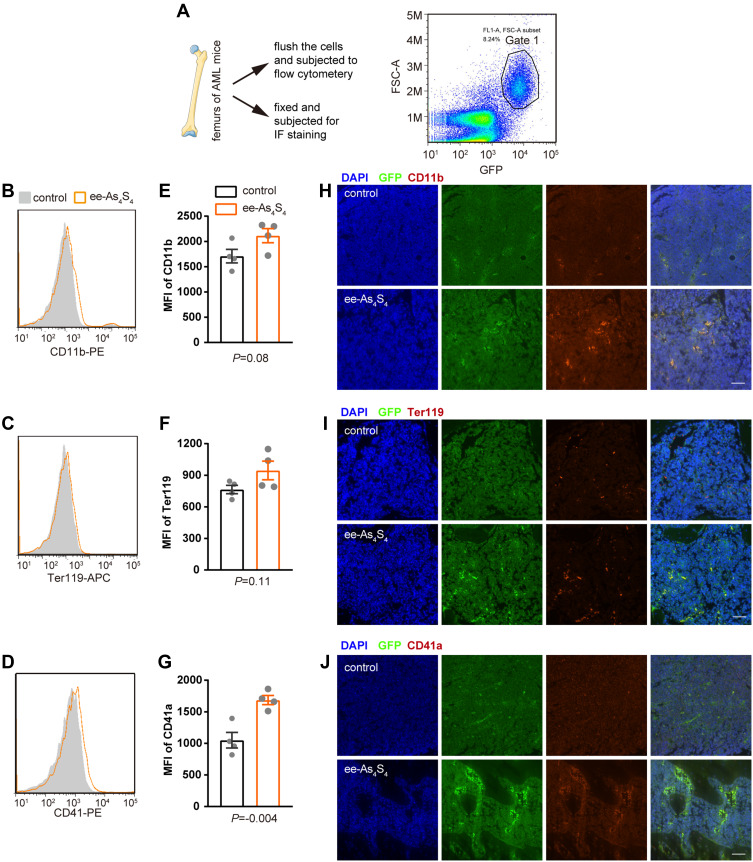
Figure 4.
The ee-As4S4 induced multi-lineage differentiation in vivo. (A) Illustration of the bone marrow assay and the gated scheme, cells in Gate 1 are leukemia cells. (B–D) Overlap distribution of CD11b, Ter119, and CD41 expression in the leukemia cells in the control group and the ee-As4S4-treated group. (E–G) Mean fluorescence intensity of the three markers in leukemia cells. (n=4) (H–J) Immunofluorescence staining of the three markers in femurs of mice from control and ee-As4S4 group.

