Figure 5.
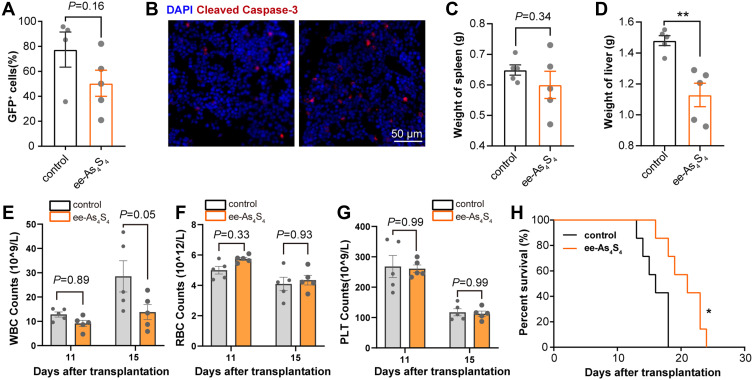
The ee-As4S4 induced apoptosis in vivo. (A) The percentage of GFP+ leukemia cells in the bone marrow determined by flow cytometry. (B) Immunofluorescence staining of cleaved caspase-3 in the femur of mice from control and ee-As4S4 group. (C and D) The weight of spleen and liver of AML mice (n=5). (E–G). The count of WBC, RBC, and PLT (n=5). (H) Survival curve of AML mice (n=7). *P < 0.05, **P<0.01.

