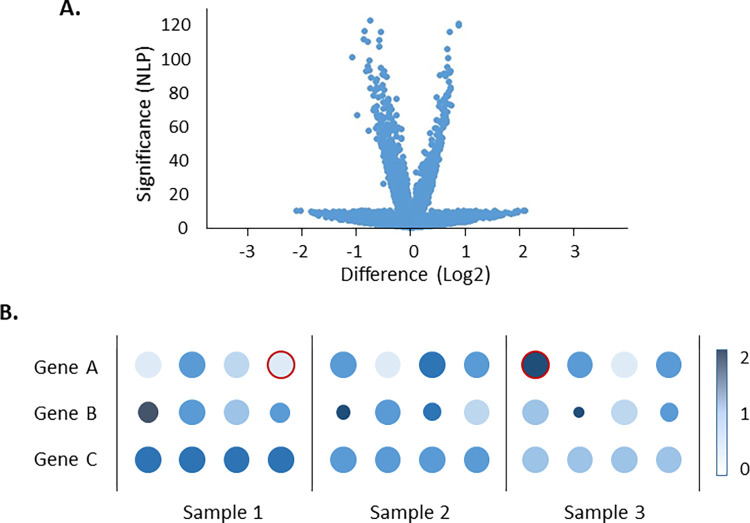
Fig 1. Illustration of Sample Effects.
(A) Stylized volcano plot typical of single cell results, showing inflation of test statistics (negative log P-values over 100) and inner and outer bursts of points. (B) Stylized dot plots, with 4 individuals for each of 3 sample types and 3 genes, where color represents intensity of expression (log2 counts per 10,000, scale to right) and size represents proportion of cells. For gene A, Sample 1 appears to have lower expression than the others, but transposition of just the red-outlined individuals between Samples 1 and 3 would equilibrate the pooled expression. For genes B and C, the expression levels are greatest in Sample 1 and least in Sample 3 when pooling all 4 individuals, but given the variability among individuals for Gene B the difference is unlikely to be significant, whereas accounting for individual effects for Gene C enhances the significance since there is low heterogeneity among individuals.

