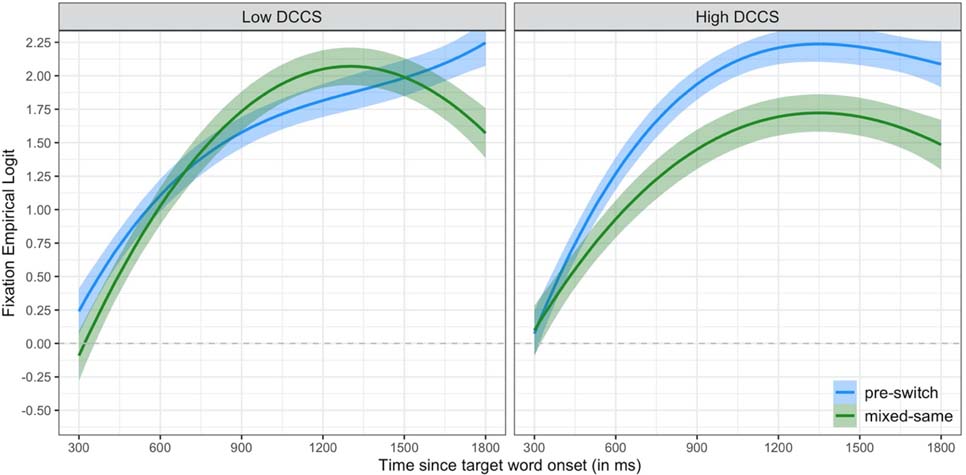
Figure 3.
Time course of children’s fixations to the target object on trials where the dimension was the same as the previous trial in the pre-switch block (pre-switch; in blue) and in the mixed block (mixed-same; in green). The lines are the growth curve model fits for a child with an average Flanker score and DCCS score 1 SD below average (left panel) or 1 SD above average (right panel). The ribbons around the lines represent +/− 1 SE. The dashed horizontal line at 0 is chance (i.e., equal likelihood of fixating to the target and the distractor object).

