
Figure 3.
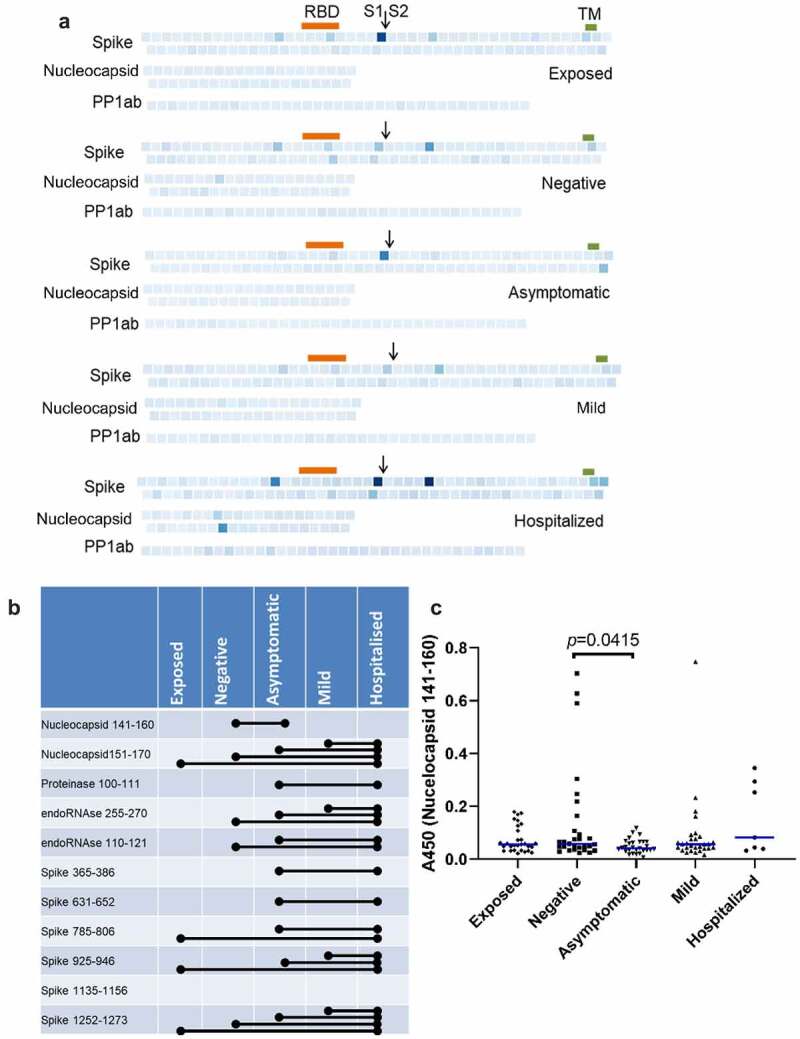
Prevalence of IgGs specific for SARS-CoV-2 peptides. (b) Individual peptides with significant variation between groups (p < 0.05, ANOVA, n = 7–30). Bars denote groups with significant differences by pairwise comparison (Tukey HSD, p < 0.05).