
Figure 5.
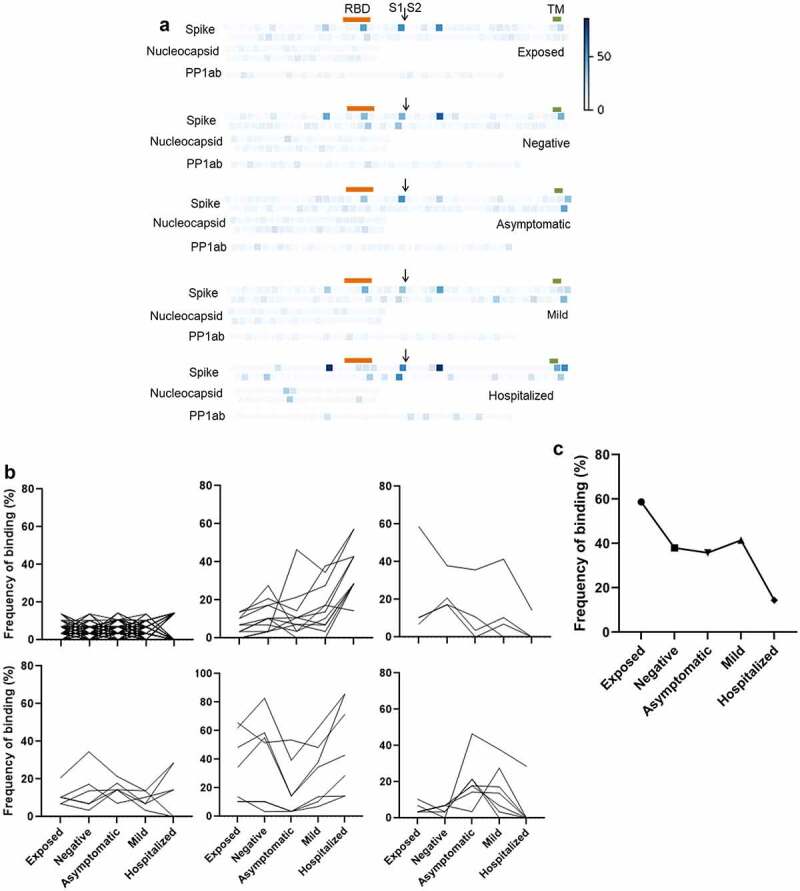
Frequency of seropositivity for IgGs specific to individual peptides in the different groups. (a) Frequency of seropositivity for each peptide. Each square indicates an individual peptide with color intensity proportionate to the frequency with which individuals in each group show antibody binding above background. Arrangement of squares indicates the approximate relative locations of the overlapping peptides in spike, nucleocapsid, and polyprotein 1ab proteins. Approximate locations of the RBD (319-541, orange), S1/S2 furin cleavage site (685, arrow), and transmembrane domain (1213-1237, TM, green) are shown for spike. (b) Distribution of peptides according to frequencies of seropositivity within each group. (c) Frequency of seropositivity for IgG specific to spike 506-525 in each group