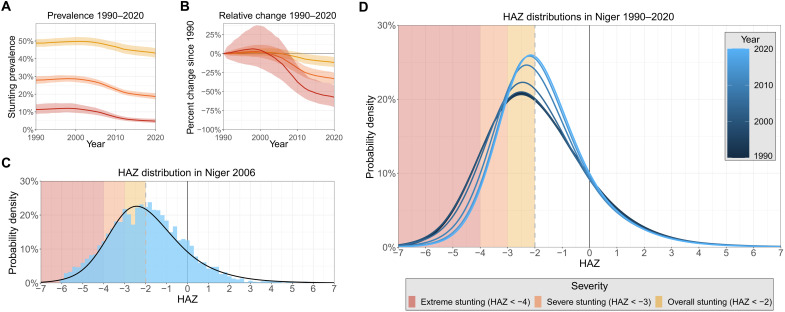
Fig. 1. Stunting trends and distribution curves in Niger.
Trends in each severity of stunting in Niger from 1990 to 2020 (A). The yellow line for overall stunting reflects the conventional stunting monitoring metric; relative changes in each severity since 1990 (B). A step in our methodology by which we incorporate surveys with individual measurements of HAZ to paramaterize characteristic curves of HAZ. Here, individual anthropometric measurements from the 2006 Demographic and Health Survey in Niger are overlaid with the curve of final HAZ estimates for Niger in 2006 (C). This process is completed for all years, yielding a sequence of changing HAZ curves over time (D).

