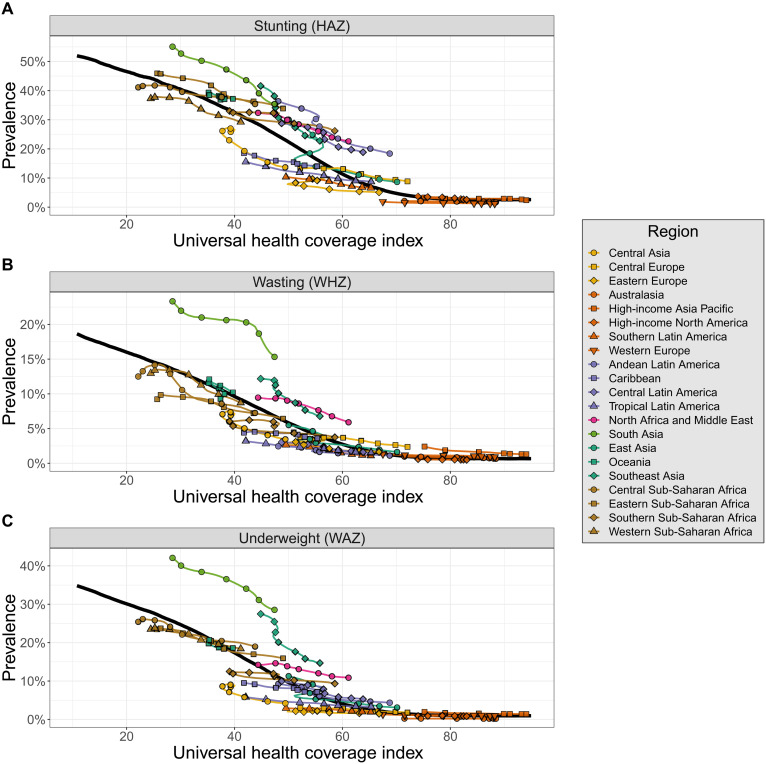
Fig. 4. Estimated overall stunting, wasting, and underweight prevalences by region compared to what would be expected based on the UHC index.
The expected values of overall stunting (A), wasting (B), and underweight (C) based on the UHC index are represented by the solid black lines. Estimated values of overall CGF are shown for each region and colored by super region. Points are shown every 5 years from 1990 to 2020.

