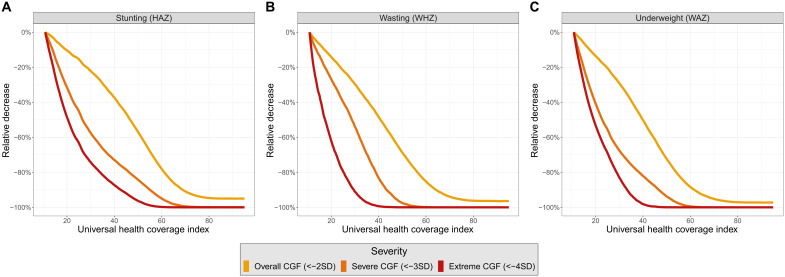
Fig. 5. Expected values of overall, severe, and extreme CGF scaled to show how trajectories change as the UHC index improves.
Expected values of overall, severe, and extreme CGF scaled to show how trajectories in stunting (A), wasting (B), and underweight (C) change as the UHC index improves. Prevalences have been scaled to demonstrate expected relative changes as the UHC index increases from the minimum observed UHC index value.

