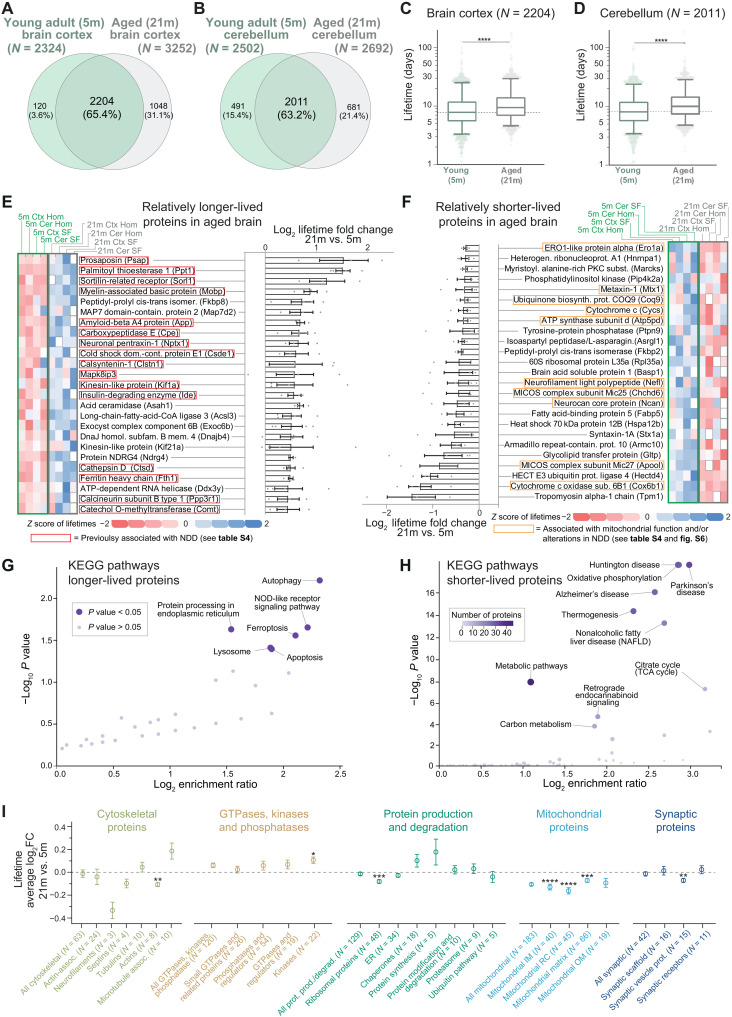
Fig. 2. Specific lifetime changes in the aging brain.
(A and B) Venn diagrams of lifetimes measured here [“aged mice”; 21 months (21m)] or previously published [“young adult mice”; 5 months (5m); (19); see also table S3]. (C and D) Comparison of lifetimes in cortex (C) or cerebellum (D) of 5- and 21-month-old mice (nonparametric Wilcoxon matched-pairs signed-rank test, ****P ≤ 0.0001; boxplots represent median, 25th to 75th percentile, with whiskers showing 5th to 95th percentile). Turnover is significantly lower in both cases. (E and F) Summary of 50 proteins whose lifetime after rescaling is either relatively longer-lived (rLL) (E) or relatively shorter-lived (rSL) (F) in at least three of four turnover datasets analyzed here (brain cortex, cerebellum, synaptic cortical, and synaptic cerebellar fraction; see also table S3). Heatmaps show lifetimes color-coded as z scores. Gray boxes, not measured. Log2 fold change (log2FC) summarizes ratios of protein lifetimes of 21- versus 5-month-old mice (±SEM). Red boxes in (E) indicate proteins implicated in NDDs (see table S4). (G and H) Kyoto Encyclopedia of Genes and Genomes (KEGG) pathway analysis of rLL in aged mice in all four datasets (G) (N = 72) or always rSL in aged mice (H) (N = 128), showing lifetime changes of at least >10% (for details, see table S3 and fig. S6). Several mitochondrial proteins linked to NDDs appear relatively shorter-lived in aged mice as summarized in (H) and in fig. S6B. (I) Proteins either rLL or rSL in aged mice according to functional affiliation [see (19) and table S5]. Mean ± SEM of the log2FC (21 months versus 5 months). Proteins per category are indicated in parentheses. Significance against the consistently changed lifetimes was calculated using Brown-Forsythe and Welch ANOVA followed by Dunnett multiple comparison correction (*P ≤ 0.05, **P ≤ 0.01, ***P ≤ 0.001, and ****P ≤ 0.0001). Only significant categories are reported (for the remaining list, see fig. S7).

