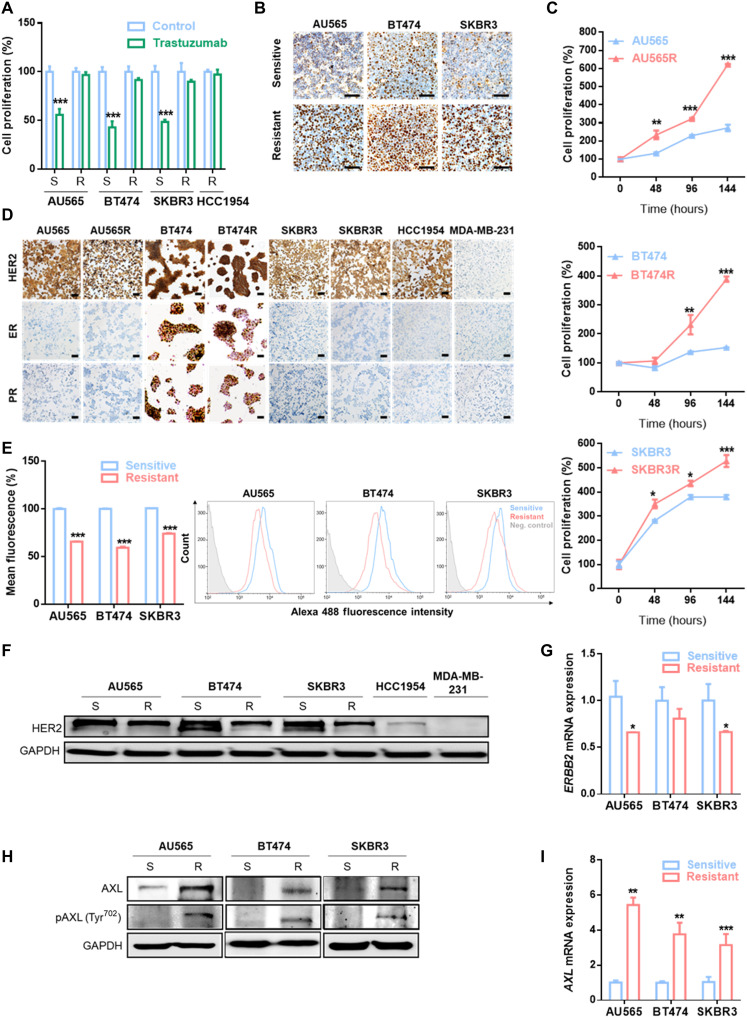
Fig. 1. Trastuzumab-resistant HER2+ BC cell line characterization.
(A) Cell proliferation analysis by WST-1 in trastuzumab-sensitive and trastuzumab-resistant cell lines with and without trastuzumab treatment at 15 μg/ml for 7 days. (B) IHC staining of Ki67 in the indicated cell lines. (C) Comparison of basal cell proliferation by WST-1 in trastuzumab-sensitive and trastuzumab-resistant cell lines over 144 hours. (D) IHC staining ER, PR, and HER2 in the indicated cell lines. MDA-MB-231 was used as a negative control for HER2, ER, and PR staining. Flow cytometry analysis of HER2 expression in cell membrane (E), Western blot analysis for total HER2 expression (F) and RT-qPCR analysis of ERBB2 mRNA expression (G) in trastuzumab-sensitive and trastuzumab-resistant cell lines. Western blot analysis of AXL and phospho-AXL (H) and RT-qPCR analysis of AXL mRNA expression (I) and in trastuzumab-sensitive and trastuzumab-resistant cell lines. Scale bars, 100 μm; magnifications, ×20 (B) and ×10 (D). GAPDH was used as an endogenous control in (F) to (I). Flow cytometry negative control was stained with isotype primary antibody in (E). *P < 0.05, **P < 0.01, ***P < 0.001 by two-tailed Student’s t test in (A), (C), (E), (G), and (I).

