
FIGURE 2.
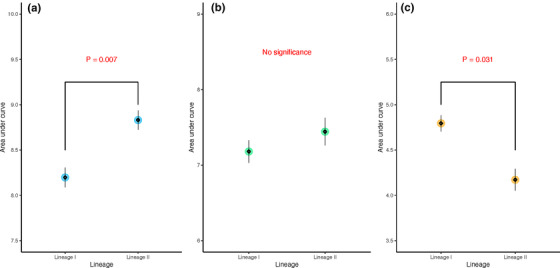
Comparison of area under curve of Listeria monocytogenes (Lm) growth between lineages at (a) 25°C, (b) 37°C, and (c) 42°C. The big circle refers to the model estimates, while the diamonds and the error bar present the mean and standard error of the raw data, respectively