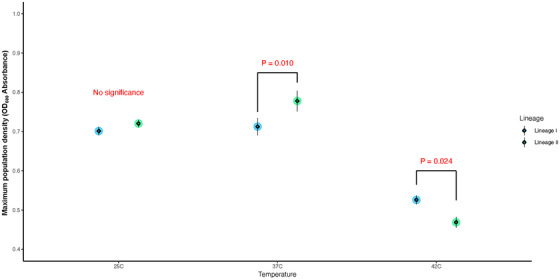
FIGURE 4.

Comparison of maximum population density of Listeria monocytogenes (Lm) growth between lineages at three temperatures. The big circle refers to the model estimates, while the diamonds and the error bar present the mean and standard error of the raw data, respectively
