
GRAPHIC 1.
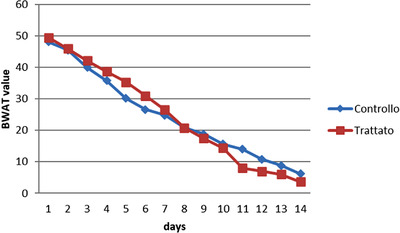
BWAT scale graphic describing the variation of patient's pain/discomfort until healing (BWAT = 8) in both control and treated groups
Official websites use .gov
A
.gov website belongs to an official
government organization in the United States.
Secure .gov websites use HTTPS
A lock (
) or https:// means you've safely
connected to the .gov website. Share sensitive
information only on official, secure websites.
BWAT scale graphic describing the variation of patient's pain/discomfort until healing (BWAT = 8) in both control and treated groups