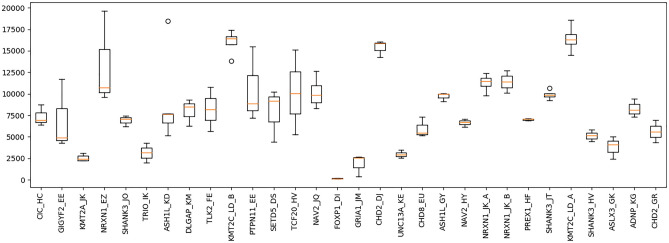
Figure 2.
Depth of coverage of target regions. The name of each target region represents the gene name and the assigned pedigree ID. The average depth of sequence coverage varied significantly for different PCR amplicons, between 19,626.4 and 127.53 fold. The depth of coverage for PCR amplicons was significantly more uniform within target regions than between, with the average depth per target region varying significantly between 158× and 16418× [ANOVA: F(29, 70) = 10.05; P = 2.446 × 10⁻¹⁵]. Statistical outliers indicated by circles.

