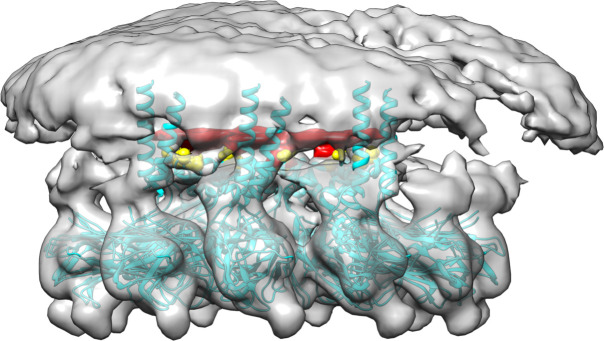
Figure 1. Structural model of human seipin.
(a) Structure of a seipin subunit. The structure included in the cryoelectron microscopy data is shown in gray. Red loops were modeled with Modeller (Fiser et al., 2000). The blue region was predicted using the yeast structure. The helical structures were extended (yellow). (b) Structure of the human seipin oligomer used in the simulations. Each chain is shown with different colors. (c) Comparison of transmembrane segments of human seipin used in this study (gray) and yeast seipin (blue; PDB 7OXP).


