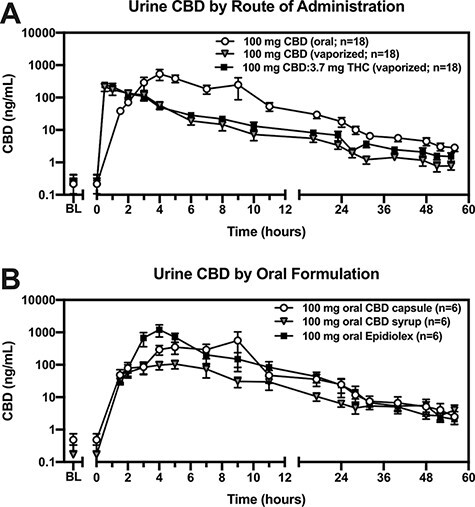
Figure 1.

Urine CBD concentrations across dosing conditions. Urine CBD concentrations (ng/mL; y-axis; log10 scale) are plotted (mean ± SEM) by time (post-drug-administration; x-axis) for each (A) route of administration and (B) oral formulation. The 100 mg CBD (oral) condition in panel A represents each of the three oral formulations collapsed.
