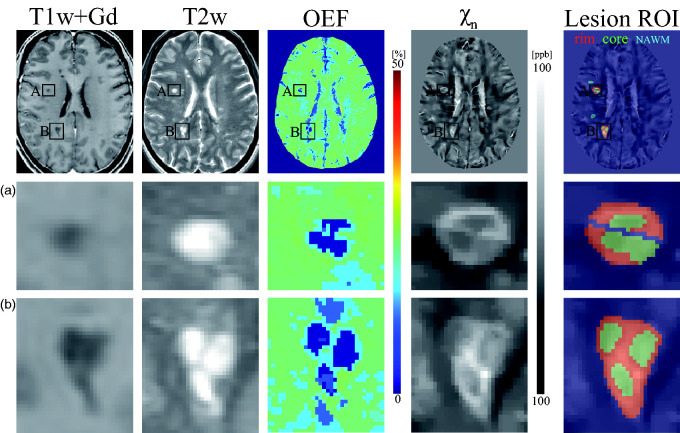
Figure 1.
Example of T1w+Gd image, T2w image, OEF and neural tissue susceptibility ( ) maps obtained from an MS patient (disease duration, 11 years) showing two chronic active lesions with paramagnetic rims (A and B). In both lesions, the rim regions (red) show higher OEF and than the core regions (green). The central vein within lesion A is excluded from the lesion ROI. Normal appearing white matter (NAWM) mask for each lesion is shown in cyan blue in lesion ROI map.

