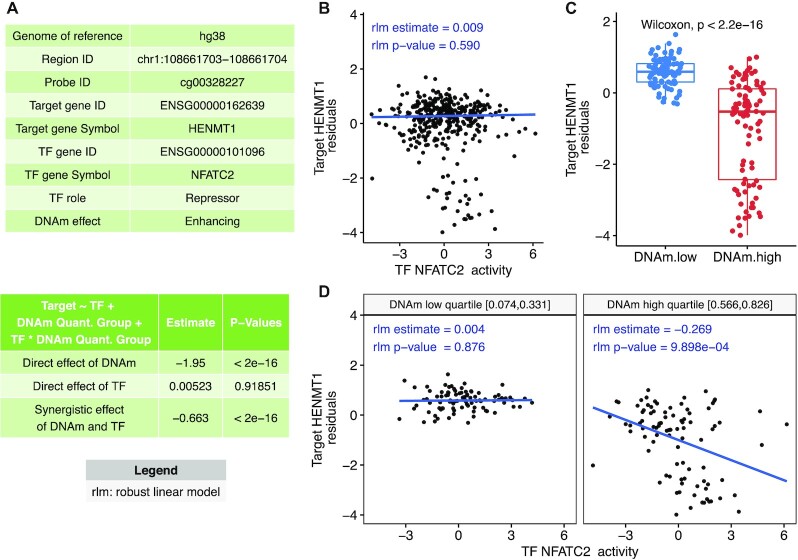
Figure 3.
Example output from MethReg analysis of the TCGA COADREAD dataset. (A) The first table shows the triplet (CpG, TF, target gene) metadata, TF role (repressor or activator) and DNA methylation effect on the TF (enhancing or attenuating). The second table shows the results from fitting robust linear model target gene expression residual ∼ DNAm group + TF + TF × DNAm group, where DNAm group is 0 if the sample has low DNA methylation levels (in the lowest quartile) at the given CpG or 1 if the sample has high methylation levels (in the highest quartile), indicating significant DNAm × TF interaction effect (P < 2 × 10–16). (B) When all samples are considered, there is no association between target gene expression and TF activity (each dot represents a sample). (C) Comparison of target gene expressions between the DNAm groups shows samples with lower DNA methylation have higher target gene expression. (D) Scatter plot of target gene expression residuals versus TF activity stratified by DNAm group (only samples in DNAm high or low groups are shown). In samples with high DNA methylation, TF represses target gene expression. In samples with low DNA methylation, target gene expression is relatively independent of the TF. Therefore, TF is predicted to be a repressor and DNAm is predicted to enhance the effect of TF on the target gene. Abbreviations: DNAm, DNA methylation; target gene expression residual, linear model residuals obtained after removing effects of copy number alteration (CNA) and tumor purity estimate from gene expression data.

