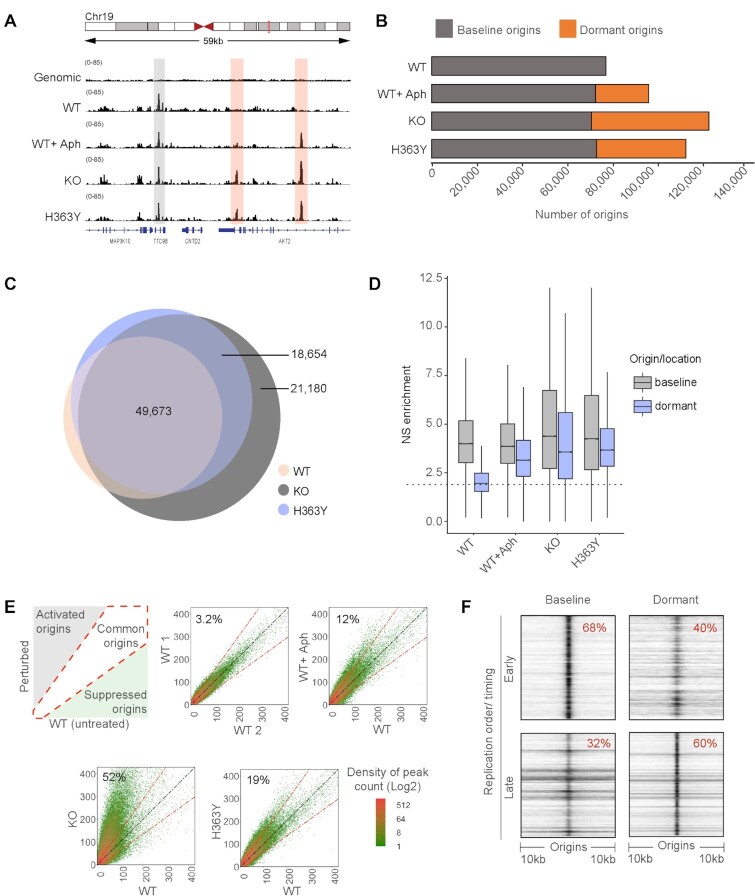
Figure 2.
A similar pool of dormant origins is activated in SIRT1 deficient cells and in cells undergoing replication stress. (A) IGV (Integrative genomics viewer) (67) screenshot of active origins mapped by NS-seq in WT, KO and H363Y HCT116 cells. Origins activated in WT are referred to as baseline origins whereas origins that are additionally activated in KO and H363Y but not in WT are referred to as dormant origins. Gray and red highlights show the genomic locations of baseline and dormant origins, respectively. (B) Bar plot representing the comparison between (active) baseline and dormant origins obtained in the HCT116 SIRT1 model system (WT, WT + Aph, KO and H363Y, and replicates of each sample). Here ‘baseline’ origins refer to origins initiated in untreated WT and ‘dormant’ origins were those with auxiliary origin initiation relative to that of baseline origins in respective cells/conditions. (C) Overlaps among replication origins in WT, KO and H363Y cells. Overlaps were calculated using ‘Intervene Venn 3-way’ comparison module and plotted using ‘Eulerr’. Numbers in the Venn diagram represent the number of origins in each group. (D) Box-whisker plot comparing replication initiation activity among baseline and dormant origins. Nascent strand (NS) enrichment was calculated using BAMScale as a function of library size reads per coordinates (origins) for respective NS-seq/ genomic control. The dotted line represents median NS enrichment on random genomic intervals (generated using ‘bedtools random’ module). (E) The left upper panel is a schematic of density plots comparing origins usage in treated/perturbed WT cells compared to unperturbed WT cells. The diagonal white area represents origins that initiate equally in both treated and untreated WT cells. The gray-shaded area indicates origins activated upon perturbation (1.5-fold higher origin initiation activity compared to untreated WT), whereas the green-shaded area represents origins that are suppressed upon perturbation. From left to right, top to bottom: density plot illustrations for origin initiation between two replicates of untreated WT; WT without versus WT with aphidicolin treatment (WT + Aph, 0.8 μM for 24 h); WT versus KO cells; and WT versus H363Y cells. Percentages represent dormant origin initiation in respective (Y-axis) samples. (F) A heatmap generated using ColoWeb (42) representing the association between genomic locations of early and late-replicating regions with baseline (WT) or dormant (from KO) origins in HCT116 cells.

