Figure 4.
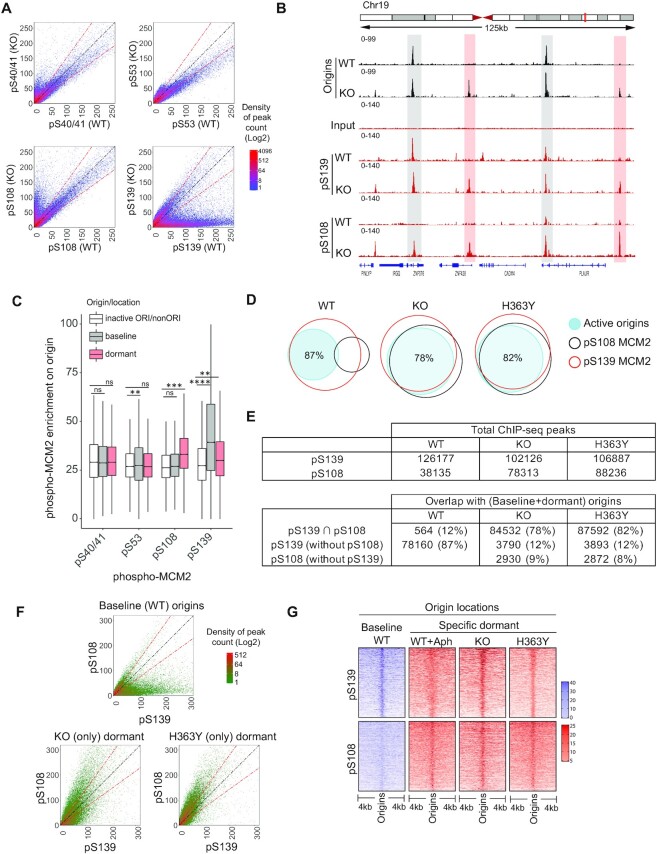
Phosphorylation of MCM2 on S108 is differentially associated with activation of dormant origins in SIRT1-deficient cells. (A) Density plots comparing the binding of four MCM2 phosphoisoforms (phosphorylated S40/41, S53, S108 and S139) on chromatin from WT and KO HCT116 cells. (B) IGV screenshot of overlaps between origin sites mapped by NS-seq in WT and KO cells and binding sites for phospho-MCM2 (pS139 and pS108) mapped by ChIP-seq. Examples of interactions at baseline and dormant origins are highlighted in gray and red highlights, respectively. (C) Box-whisker plot illustrating pMCM2 enrichment on origins as a function of the relative occupancy of four MCM2 phosphoisoforms on baseline origins (KO), dormant (KO) or inactive/non-Ori (remaining binding sites of phospho-MCM2 from KO) (see Supplementary Figure S5C for phospho-MCM2 enrichment in WT, KO and H363Y cells). Serine phospho-MCM2 ChIP-seq enrichment was calculated from ChIP-seq library normalized signals on each origin category using BAMScale and represented as a ratio between ChIP/Input. pMCM2 enrichment in KO cells was used as these cells initiate replication at both baseline and dormant origins. Kruskal–Wallis test was used to determine statistical significance. Ns = non-significant, ** represents P< 0.01, *** represents P< 0.001 and **** represents P< 0.0001, respectively. (D) Venn diagrams comparing the binding occupancy pS139-MCM2 (red) and pS108-MCM2 (black) on total (baseline + dormant) active origins (blue shaded) in WT, KO and H363Y cells. The numbers of common and exclusive peaks (binding sites or origins) were calculated by ‘intersection’ module of bedtools. Active origin peaks obtained from NS-Seq were compared with pS139-MCM2 or pS108-MCM2 binding sites obtained from ChIP-Seq in the indicated cells. Percentages indicate fractions of origins overlapping with phosphor-MCM2. See (E) for additional comparisons. (E) The number of total (top) and overlapping (bottom) chromosomal sites for ChIP-seq peaks (pS139 and pS108-MCM2) and origins within a comparison group. ‘∩’ represents shared sites between comparative groups. (F) Density plots showing comparative coverages of pS139-MCM2 and pS108-MCM2 on baseline origins (total origins from WT cells) or dormant origins in KO or H363Y cells. (G) A heatmap representing the binding of pS108-MCM2 and pS139-MCM2 (as determined by ChIP-seq) to baseline and dormant origins in the indicated cells, with or without Aph treatment. Baseline origins in WT cells are shown in purple; specific dormant origins are in red. Using an R-script (heatmapper2(38), see Methods), coverage for each MCM2 phosphoisoform was calculated and 5000 randomly selected peaks were represented as heatmap.

