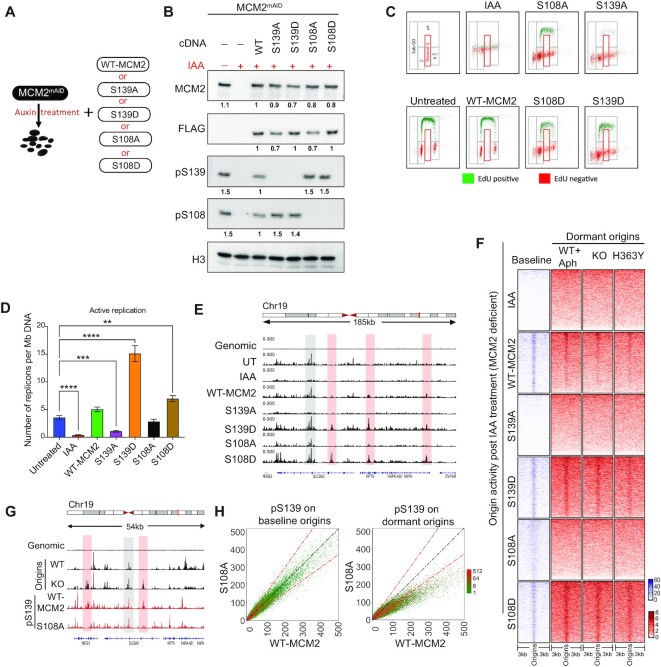
Figure 6.
Stress-dependent pS108-MCM2 is also required for dormant origin activation. (A) Scheme for the depletion of endogenous MCM2 and compensatory expression of WT or mutant MCM2 in HCT116 cells. Five cell lines were generated by exogenously expressing cDNA for WT-MCM2 or mutant MCM2 at serine residues S139A, S139D, S108A and S108D in cells expressing the endogenous MCM2mAID. MCM2mAID is degraded upon treatment with auxin (IAA) leading to cells with MCM deficient/null phenotype. (B) HCT116-MCM2mAID cells were treated with IAA (500 μM) for 48 h and expression levels of total MCM2, pS108-MCM2 and pS139-MCM2 were measured in total cell extracts using immunoblotting. FLAG tag present in the MCM2-cDNA serves as a control for comparative expression of all MCM2 cDNA. Untreated MCM2-mAID cells were used as a positive control. The number under each signal represents the ratio of the intensity of each protein normalized to the intensity of the same protein in WT-MCM2 transfected cells. Histone 3 (H3) was used as a loading control. (C) EdU/DAPI flow analyses for mutants described in A,B after 48 h IAA treatment. Top left panel represents the gating strategy used for quantification and other panels represent EdU incorporation profiles for each mutant MCM2. IAA treatment depleted the endogenous MCM2 protein. (D) The number of active replication forks calculated using DNA-combing in cells harboring either WT-MCM2 or mutant MCM2s as described in the legend to Figure 5D. The Mann–Whitney test was used to determine the statistical significance. **represents P< 0.01 and **** represents P< 0.0001. (E) IGV screenshot of active origins mapped by NS-seq in cells harboring WT-MCM2 or phospho-mutant MCM2. Selected initiation of baseline and dormant origins in mutant MCM2-expressing cells are shown in gray and red highlights, respectively. (F) Heatmap comparing coverage of active origins between cells with WT- or mutant MCM2 and cells with SIRT1 WT, KO and H363Y mutant, as well as stress-induced dormant origins. (G) IGV screenshot of coverage of NS-seq in WT and KO (SIRT1), (as represented in Figure 2A) and ChIP-seq for pS139-MCM2 obtained from HCT116 cells harboring either WT or S108A MCM2. Red and gray highlights represent examples of baseline and dormant origin sites. See Supplementary Figure SS7E for total number and percent overlap between baseline and dormant origins. H: Comparative dot plot for occupancy of pS139-MCM2 at chromosomal sites for baseline (from WT-SIRT1 cells, left) and dormant (from KO-SIRT1 cells, right) origins in cells harboring WT MCM2 and S108A MCM2.

