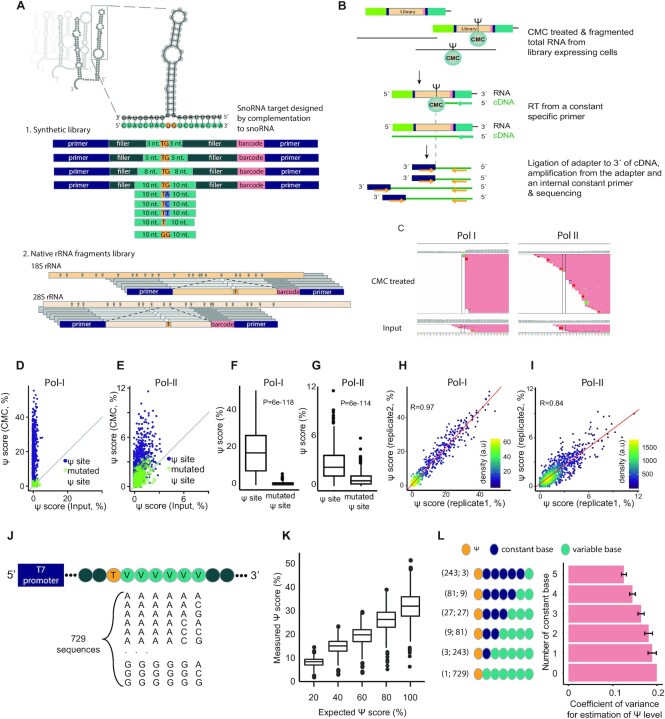
Figure 1.
Massively parallel reporter assay-based method for quantification of Ψ at broad-range stoichiometries. (A) Design of the snoRNAs’ targets library. 1. Synthetic library—targets for 68 snoRNAs were designed by varying the degree of complementarity of the target to the binding loop of the snoRNA, from upto 3 to 10 nt from each side of the Ψ site (Materials and Methods). In addition, point mutations or a deletion of the first position following the pseudouridylation site were designed for part of the snoRNAs (see Materials and Methods). For each snoRNA, an additional variant with 10 nt-long complementarity was designed in which the modified uridine was mutated into a guanosine. 2. Native rRNA fragments library—each library variant was designed in a manner positioning a known Ψ site in ribosomal RNA sequences or snRNAs in a constant position. (B) The libraries were transfected into HEK-293T cells, and total RNA was extracted, treated with CMC and used for NGS library preparation. A library specific Ψ-Seq protocol (17) was used to identify reverse transcription stops, an estimate for Ψ levels. (C) Representative data of one of the snoRNA targets (E2 snoRNA). A significant pileup of reverse transcription stops is present in the expected site (highlighted by parallel lines) when the library is treated with CMC compared to control (Input) samples. The transcription stops are more prevalent in Pol-I-driven constructs. (D, E) Library specific Ψ-Seq was conducted on HEK-293T samples transfected with Pol-I- or Pol-II-promoter libraries and treated with CMC or input (n = 2). Shown are native rRNA and snRNA sites and synthetic sites with 8 or 10 nt-long complementarity to a known snoRNA (purple) and their counterparts, in which the modified uridine was mutated (green). Grey lines represent a positive correlation of one between conditions. (F, G) Ψ-score of native rRNA and snRNA sites and synthetic sites with 10 nt-long complementarity to a known snoRNA and counterpart sites mutated in the modified uridine, in samples treated with CMC. P values represent results of two-tailed paired t-tests. (H, I) Pearson's correlation between the Ψ-score of two biologically independent samples. Regression line in red. Kernel density estimate of data distribution in arbitrary units (a.u). (J) Design of the in vitro transcription library containing 729 sequences, each encoding a single thymidine (T; yellow) followed by six varying bases (V; light green). The seven bases are embedded in a backbone of 111 nts and flanked by a spacer, a T7 promoter and a sequence used for priming of reverse transcription. Varying bases represent all possible combinations of adenine, cytidine and guanine. (K) Sequences from (J) were transcribed in the presence of uridine or pseudouridine, and mixed to generate the indicated ratios (x-axis), followed by treatment with CMC and generation of libraries to assess individual Ψ scores. (L) Coefficient of variance, allowing to assess the effect of downstream bases on measured Ψ scores, was calculated on subsets of sequences from K, which were transcribed using 100% Ψ. The bottom bar represents the maximal coefficient of variance calculated for a single group with all 729 sequences (1;729 in brackets), the top bar represents an averaged coefficient of variance calculated based on binning all sequences into 243 groups each with 3 sequences (243;3 in brackets), where each group had a fixed pattern of 5 bases downstream of the Ψ site, followed by a variable base (A, C or G) at the 6th position. Error bars represent standard error of the mean; For all box plots in the figure, the center line indicates the median, the box boundaries mark the 25th and 75th percentiles, the whiskers indicate ±1.5 × the interquartile range (IQR) and outliers are shown as individual dots.

