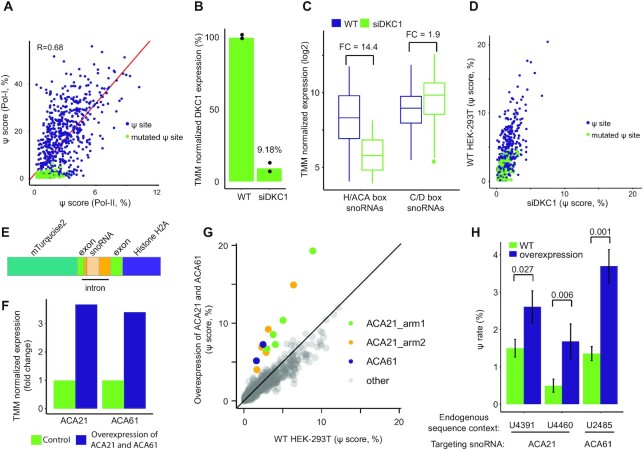
Figure 2.
Ψ signals in the MPRA system are DKC1 and snoRNA dependent. (A) Pearson's correlation between Ψ-score of constructs from CMC-treated HEK-293T samples transfected with Pol-I- or Pol-II-promoter libraries. Colors as in Figure 1D, E. N = 2 for each promoter library. (B–D) HEK-293T cells were transfected with Pol-II-promoter libraries and with siRNA targeting DKC1 or control. N = 2. (B) Normalized RNA level of DKC1. (C) Normalized RNA level of H/ACA box and C/D box snoRNAs. Boxplot parameters as in Figure 1G. FC: fold change. (D) Correlation between the Ψ-score of constructs from CMC-treated HEK-293T, colored as in Figure 1E. (E) Scheme of the snoRNA overexpression construct. (F) Normalized RNA level of ACA21 and ACA61 in WT HEK-293T cells (green) and in cells overexpressing the two snoRNAs (purple). N = 1. (G) Correlation between Ψ-score of synthetic snoRNA target constructs from CMC-treated HEK-293T samples transfected with Pol-II-promoter libraries and with plasmids overexpressing ACA21 and ACA61 or a mock plasmid (n = 1 and 2, respectively). Colors indicate whether a construct is targeted by ACA21 (green and yellow), by ACA61 (purple) or by another snoRNA (grey). (H) Ψ-scores of constructs representing native sites from 28S, which are targeted by ACA21 and ACA61, as quantified from the samples in (G). Error bars represent standard error of the binomial distribution of the mean Ψ-score. P values of generalized linear mixed models are presented.

