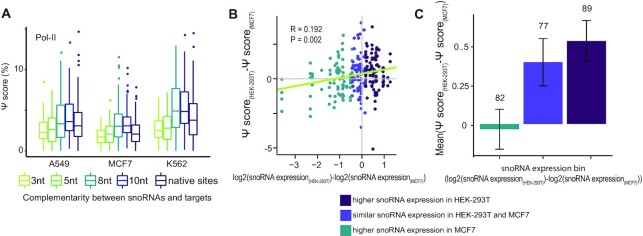
Figure 4.
Ψ level in snoRNA targets is correlated to the snoRNA abundance. (A) Ψ-score values of synthetic snoRNA constructs with increasing complementarity to snoRNAs and WT rRNA and snRNA target constructs as measured in A549, MCF7 and K562 cells transfected with Pol-II-promoter libraries (n = 1). (B) Spearman's correlation between the difference in abundance of snoRNAs in HEK-293T and MCF7 cells and the difference in Ψ-score of targets of these snoRNAs in the two cell lines. Analysis includes constructs of native 18S and 28S target sites and synthetic constructs with high complementarity (10nt and 8nt) to the targeting snoRNA. Colors indicate division into three similarly sized bins according to differential expression in the two cell lines. Regression line in green. N = 1. R, P: Spearman correlation and p value, respectively. (C) Data from (B) is represented as a barplot displaying the differential Ψ-score between HEK-293T and MCF7 cells as a function of snoRNA differential expression bin (mean ± standard error; n = 1). Number at the top of each bar indicates the number of constructs in that bin.

