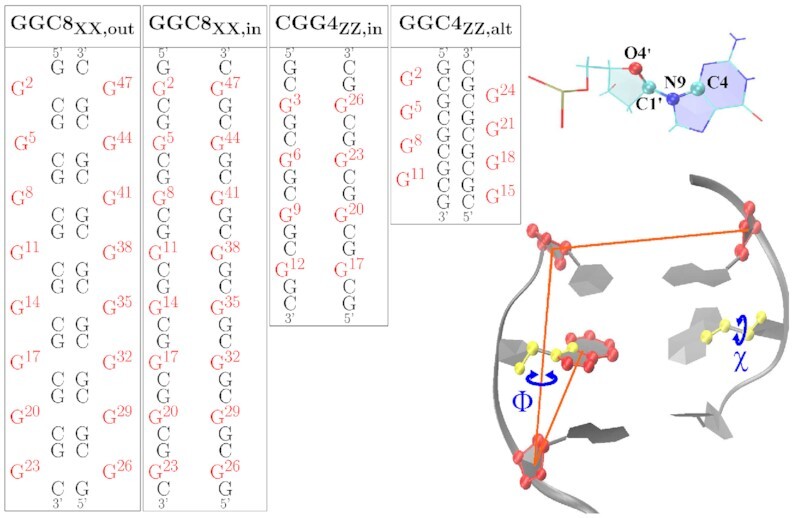
Figure 1.

Left: Sequence maps for the initial Z-DNA helices considered in this study, with G mismatched bases in red. The ‘XX’ subindex indicates either BZ or ZZ junction. The GGC4 sequences are not shown. Right: The glycosidic torsion angle χ, O4′-C1′-N9-C4, characterizes the relative base/sugar orientation, and the center-of-mass pseudo-dihedral angle Φ, as defined by the centers of mass of four atom groups, quantifies the base unstacking of a mismatched G.
