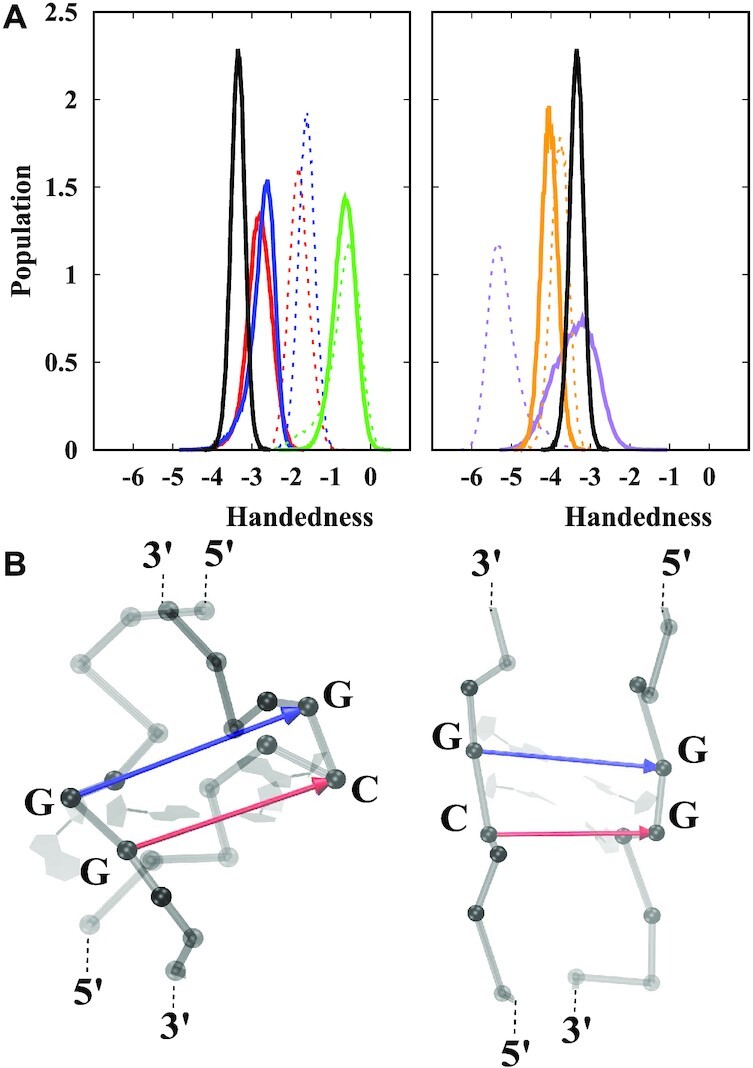
Figure 5.

(A) Distribution of handedness for the different helices, with data taken from the last 1 μs of the simulations. Red: GGC8BZ, out; blue: GGC8ZZ, out; green: GGC8ZZ, in; purple CGG4ZZ, in; orange: GGC4ZZ, alt; black: GC6Z-DNA. Solid and dashed lines denote OL15 and BSC1 FFs respectively. The data is based on results taken from the middle residues: mismatches out of the helical core are ignored and inner mismatches are considered; the number of turns in the definition of handedness is the same (11) for all helices. (B) Snapshot of the two cases where mismatches contribute zero to handedness: a fully extruded mismatch (left), and inner mismatches in locally parallel strands (right). Phosphorous atoms are shown as grey spheres. Red and blue arrows represent the vectors involved in definition of handedness. The cross product of these vectors is zero as they are parallel and thus do not contribute to handedness. See the SI for more details on the definition and calculation of handedness.
