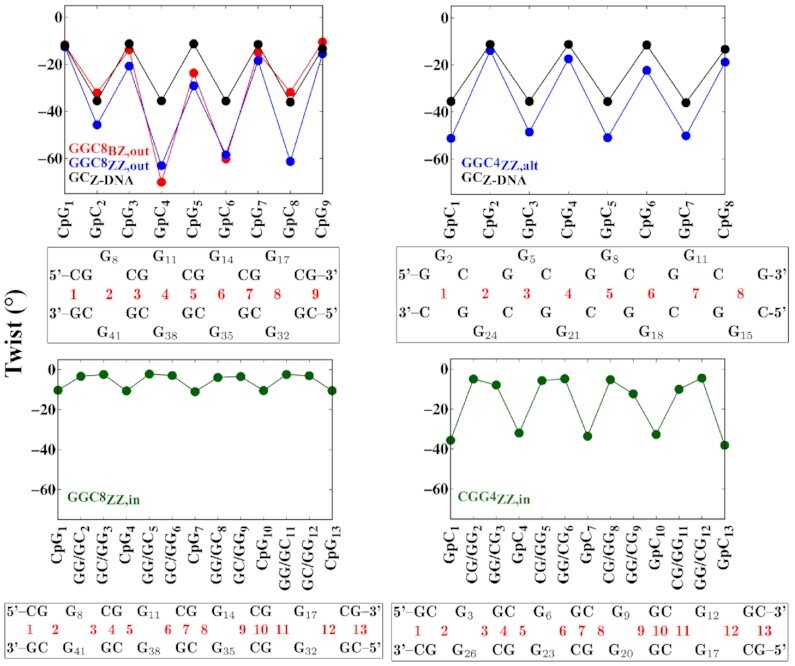
Figure 7.

Average twist angle as obtained from the last 200 ns of the simulations with the OL15 FF. Considered here are nucleotides 6–19 on one strand and the complementary nucleotides 30–43 on the other in GGC8 helices; and all residues in the shorter CGG4ZZ, in and GGCZZ, alt helices. Below each figure, a sequence map specifically identifies the steps considered in the corresponding figure. As the map indicates, the twist has been computed without the mismatches in the extruded cases in the upper panels, and with the inner mismatches on the lower panels. In the upper panels, GpC are pseudo-steps for both GGC8BZ, out and GGC8ZZ, out; and both CpG and GpC are pseudo-steps for GGC4ZZ, alt. The black line represents the twist of standard Z-DNA helix based on a sequence of GC repeats.
