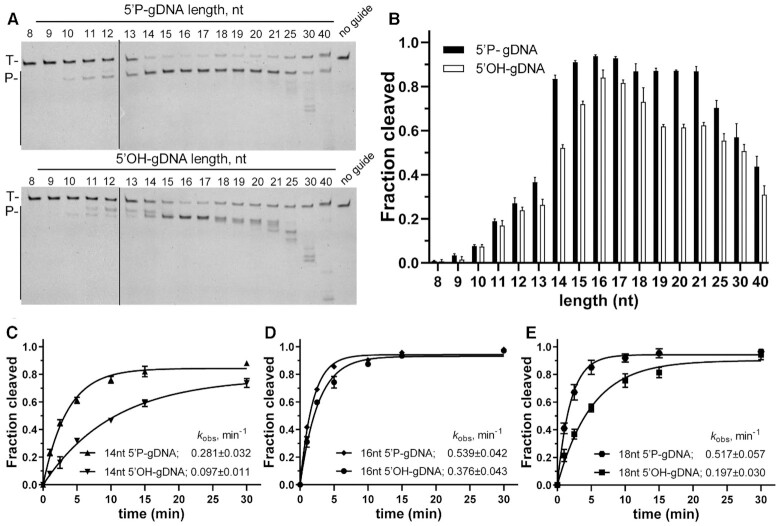
Figure 2.
Both the length and the 5′P of the guide affect cleavage efficiency and precision. (A) Cleavage assays with 5′P-gDNA (Upper panel) and 5′OH-gDNA (Lower panel) of varying lengths. The positions of the targets (T) and cleavage products (P) are indicated on the left of the gels. Representative gels from three independent measurements are shown. (B) Quantification of cleavage efficiencies (the percentage of target cleavage). The fraction of the cleaved target for each guide length is shown. Experiments in (A) and (B) were carried out for 10 min at 37°C. (C–E) Kinetics analyses of RNA cleavage by MbpAgo with 14, 16 and 18 nt gDNAs, respectively. The kobsvalues were determined from the single-exponential fits of the data. Data are represented as the mean ± standard deviation (SD) from three independent experiments. In all experiments, MbpAgo, guide and target were mixed at a 4:2:1 molar ratio (800 nM MbpAgo preloaded with 400 nM guide, plus 200 nM target) and incubated at 37°C.

