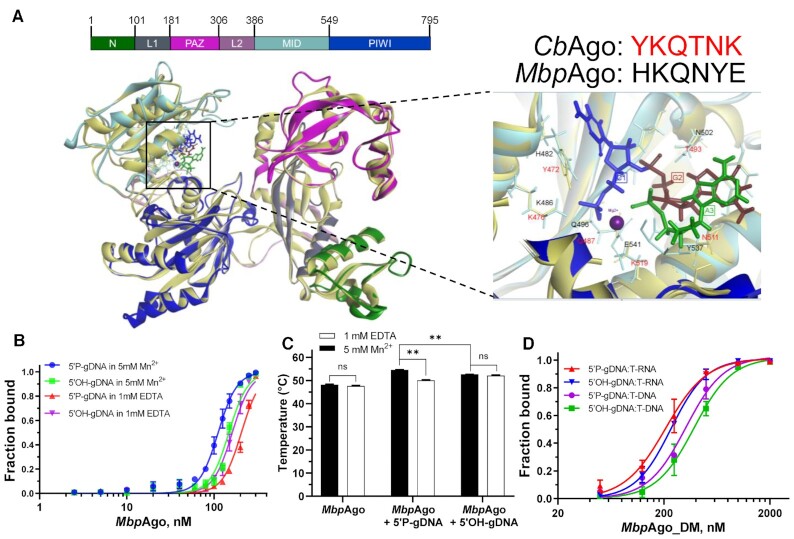
Figure 5.
Binding analyses of guides and targets by MbpAgo. (A) (Left panel) A 3D model of the MbpAgo aligned to the structure of CbAgo in complex with a gDNA and a DNA target (with bound Mg2+ ions; PDB: 6QZK). MbpAgo domains are colored according to the colored domain architecture of MbpAgo with numbered residues and CbAgo is light yellow. The model was built using the SWISS-MODEL portal. (Right panel) Amino acid residues of the conserved MID-domain motif (shown for MbpAgo and CbAgo above the structure) and Mg2+ ions (purple) involved in interactions with the first nucleotide (blue) and the second nucleotide (deep red) of the guide are highlighted. Elements of the secondary structure and amino residues specific to MbpAgo and CbAgo are shown in cyan and light yellow, respectively. (B) Binding of 16 nt guides by MbpAgo with 5 mM Mn2+ or 1 mM EDTA. The fraction of bound guides was plotted against the protein concentration and fitted using the model of specific binding with the Hill slope. Data are represented as the mean ± SD from three independent experiments. (C) Thermostability of the MbpAgo and MbpAgo–gDNA complex with 5 mM Mn2+ or 1 mM EDTA. The melting temperature of MbpAgo and the MbpAgo-gDNA complex was measured by circular dichroism. Data are the mean ± SD from three independent experiments. P-values for all comparisons of the melting temperature were calculated using Student's t-test. nsP > 0.05 and **P < 0.01. (D) Binding of the target binding by the MbpAgo–gDNA complex with 5 mM Mn2+. The fraction of the bound target was plotted against the MbpAgo–gDNA complex concentration and fitted using the model of specific binding with the Hill slope. Data are represented as the mean ± SD from three independent experiments.

