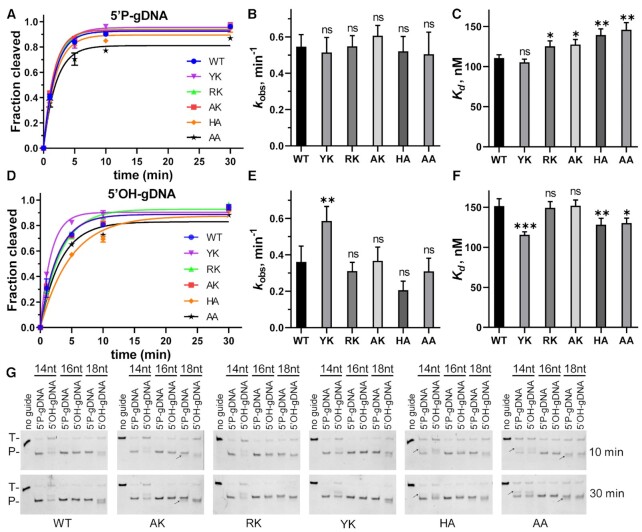
Figure 6.
Cleavage analyses of MbpAgo variants. (A) Comparison of the kinetic analysis of RNA target cleavage by MbpAgo variants guided by 16 nt 5′P-gDNA. Data were fitted using single exponential functions. In all experiments, MbpAgo variants, guide and target were mixed at a 4:2:1 molar ratio (800 nM MbpAgo preloaded with 400 nM guide, plus 200 nM target) and incubated at 37°C. (B) Comparisons of the kobs values from (A). (C)Kd values of the MbpAgo variants for binding of 16 nt 5′P-gDNA. Experiments in (D–F) were performed with 16 nt 5′OH-gDNA. Data are represented as the mean ± SD from three independent experiments. nsP > 0.05, *P < 0.05, **P < 0.01 and ***P < 0.001 compared to the WT using Student's t-test. (G) Cleavage analyses of different MbpAgo variants with 14, 16 and 18 nt gDNAs, respectively. Positions of the targets (T) and cleavage products (P) are indicated on the left of the gels. Reaction time is indicated on the right of the gels. The black arrow indicates the shifted cleavage products of AK, HA and AA variants. All experiments were performed at 37°C.

