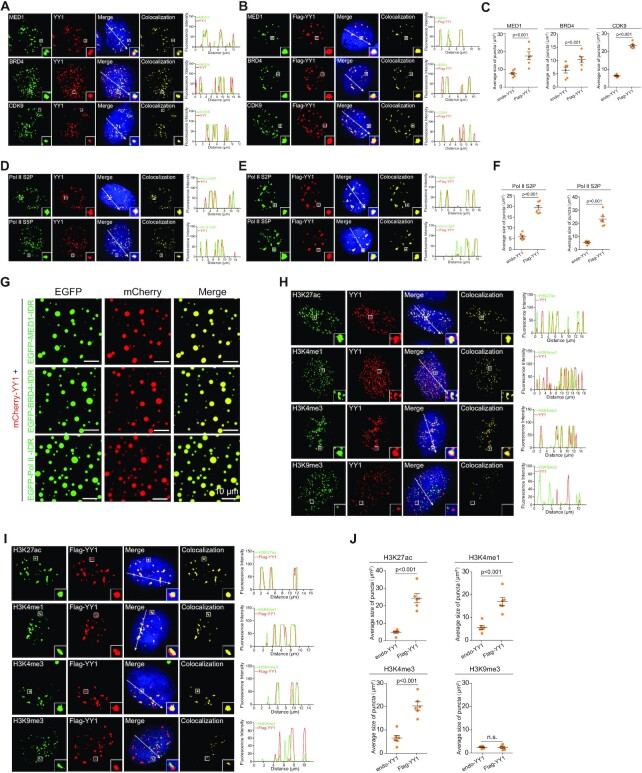
Figure 6.
YY1 compartmentalizes additional coactivators to nuclear puncta. (A and B) Colocalization of BRD4, MED1 and CDK9 with endogenous YY1 (A) or with Flag-YY1 (B) in nuclear puncta in MDA-MB-231 cells. In (B), endogenous YY1 was knocked down by sh-YY1-3′-UTR. Endogenous proteins were detected by their corresponding antibodies. Flag-YY1 was detected by a Flag epitope antibody. Nuclei were visualized by DAPI staining. Line scans of the colocalization images are depicted by white arrows with quantification shown at right. (C) Quantified average sizes of merged puncta in MDA-MB-231 cells with endogenous YY1 (A) and Flag-YY1 (B). Data are mean ± s.e.m. of puncta in 6 fields in each group. (D and E) Colocalization of active RNA Pol II with YY1 (D) or Flag-YY1 (E) in nuclear puncta of MDA-MB-231 cells. In (E), endogenous YY1 was knocked down by sh-YY1-3′-UTR. Active RNA Pol II was detected by antibodies for phosphorylation of Ser 5 (S5P) or Ser 2 (S2P), with nuclei detected by DAPI. Line scans of colocalization images are depicted by white arrows with quantification shown at right. (F) Quantification of average sizes of merged puncta in MDA-MB-231 cells with endogenous YY1 (D) and Flag-YY1 (E). Data are presented as mean ± s.e.m. from puncta of six fields in each group. (G) Representative images of droplet formation of mCherry-YY1 with EGFP-MED1-IDR, EGFP-BRD4-IDR, or EGFP-Pol II-IDR. (H and I) Localization of active (H3K27ac, H3K4me1 and H3K4me3) and repressive (H3K9me3) histone markers with endogenous YY1 (H) or Flag-YY1 (I) in MDA-MB-231 cells. In (I), endogenous YY1 was knocked down by sh-YY1-3′-UTR. Histone markers were determined using corresponding antibodies. Nuclei were detected by DAPI. Line scans of colocalization images are depicted by white arrows with quantification shown at right. (J) Quantified average sizes of merged puncta in MDA-MB-231 cells with endogenous YY1 (H) and Flag-YY1 (I). Data are presented as mean ± s.e.m. of puncta in six fields in each group. All experiments in this figure were independently repeated at least 6 times with similar results. In (C), (F) and (J), P values are indicated on top of the quantification analyses. n.s.: not significant.

