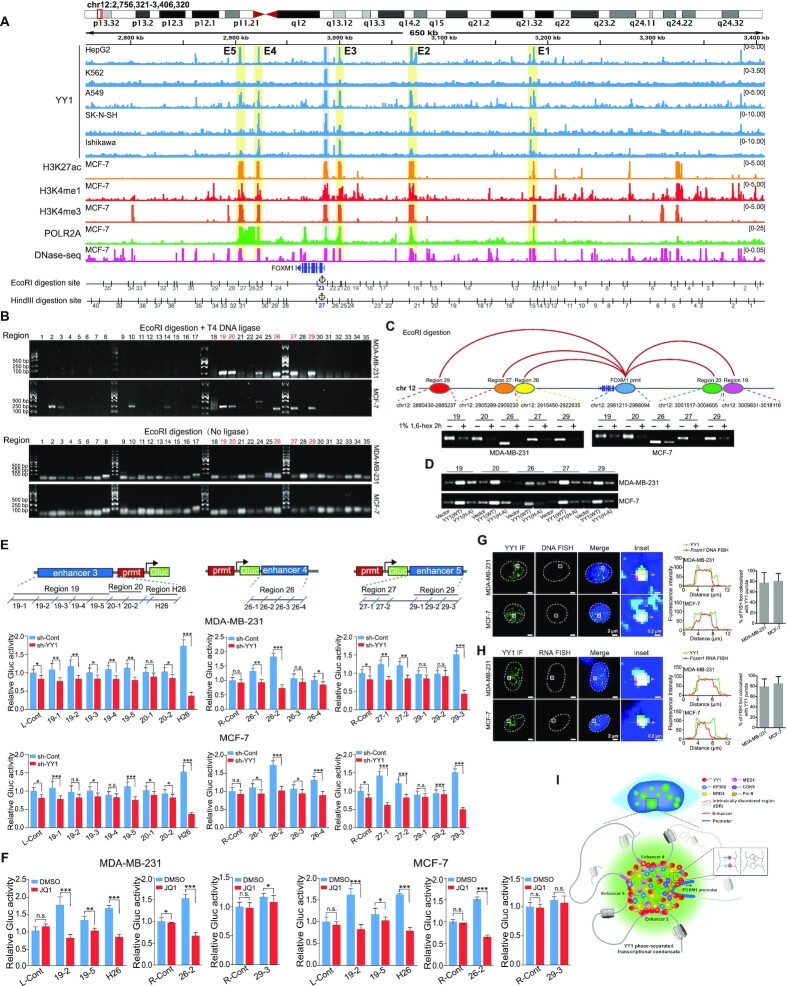
Figure 8.
YY1 phase separation is required for the connection between distal enhancer elements and the FOXM1 promoter. (A) Schematic view across the FOXM1 gene locus (chr12:2 768 321–3 408 320 [hg19]) with genomic and epigenetic information. Graphic active regulatory regions were generated using the ENCODE database, and potential enhancers (E1 to E5) are shaded in yellow. Fragments digested by EcoRI or HindIII are numbered and shown below the graph. (B) Chromatin conformation capture (3C) analysis to examine direct physical interactions between the FOXM1 promoter and enhancer elements. The 3C analyses followed the protocol in Materials and Methods, using EcoRI in genomic DNA digestion. Ligation step was performed with or without T4 DNA ligase as indicated. Numbers on the top of the gel correspond to ‘EcoRI digestion site’ in the bottom row of (A). PCR to examine direct physical interactions between the FOXM1 promoter and each of EcoRI fragments used the primer sets in Supplementary Table S3. Numbers of fragments overlapping with enhancers and interacting with the FOXM1 promoter are in red text. (C) Schematic interactions between enhancers and the FOXM1 promoter on chromosome 12 (top row), and PCR product images of ligated DNA in 3C assays conducted in the absence or presence of 1% of 1,6-hexanediol (bottom row). (D) PCR product images of ligated DNA in 3C assays in MDA-MB-231 and MCF-7 cells infected by lentivirus carrying an empty vector, or expressing Flag-YY1 WT or its (H-A) mutant. (E) Reporter assays to examine the effects of enhancers on the FOXM1 promoter. Sectionalized enhancers 3, 4 or 5 were individually placed adjacent to the FOXM1 promoter to create reporter vectors, as schematically shown in the top row. R-Cont and L-Cont indicate control fragments that are located to right and left of the FOXM1 TSS, respectively. Reporter vectors were transfected into MDA-MB-231 and MCF-7 cells with or without YY1 knockdown (bottom row). Data are shown as mean ± s.d. (n = 3). (F) Reporter assays to assess the effects of JQ1. Reporter vectors with enhancer fragments were transfected into MDA-MB-231 and MCF-7 cells with or without JQ1, followed by examining Gluc activity. Data are shown as mean ± s.d. (n = 3). (G and H) DNA FISH (G) and RNA FISH (H) assays to determine the colocalization of YY1 puncta with the FOXM1 genomic locus and FOXM1 nascent hnRNA, respectively, in MDA-MB-231 and MCF-7 cells. In G and H, each inset shows a view zoomed-in from the white box in a merge image. Line graph showed the fluorescence intensity, and histogram shows the quantification of DNA-FISH (G) or RNA-FISH (H) foci colocalized with YY1 puncta in the nucleus (n = 18 cells). (I) Schematic model of an enhancer cluster formed by YY1-mediated phase separation with incorporation of coactivators and stabilization by three distal enhancers to activate FOXM1 gene transcription.

