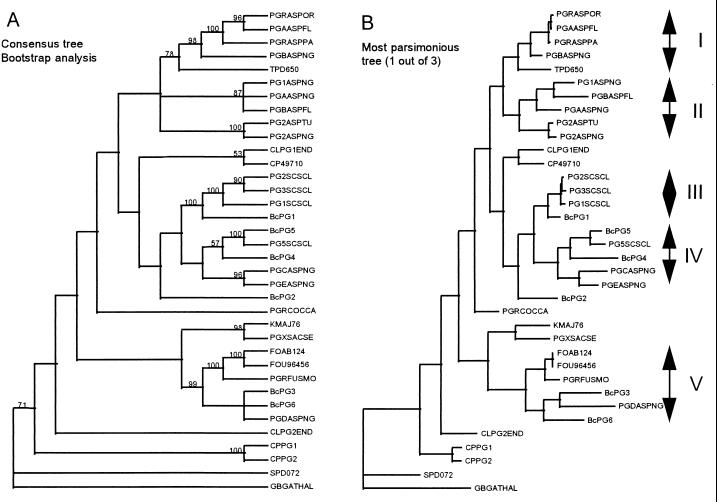
FIG. 2.
Phylogenetic analysis of fungal endoPGs. The analysis was performed by using an optimal alignment generated from the PGs depicted in Table 3. Panel A shows the consensus tree derived from three most parsimonious trees calculated by using PAUP 3.1. The different values represent the percentage of occurrence obtained after bootstrap analysis (1,000 iterations) of the phylogenetic analysis. Panel B shows the one most parsimonious tree and identifies the different monophyletic groups that we defined as a result of the analysis. The abbreviations of protein names are indicated in Table 3.

