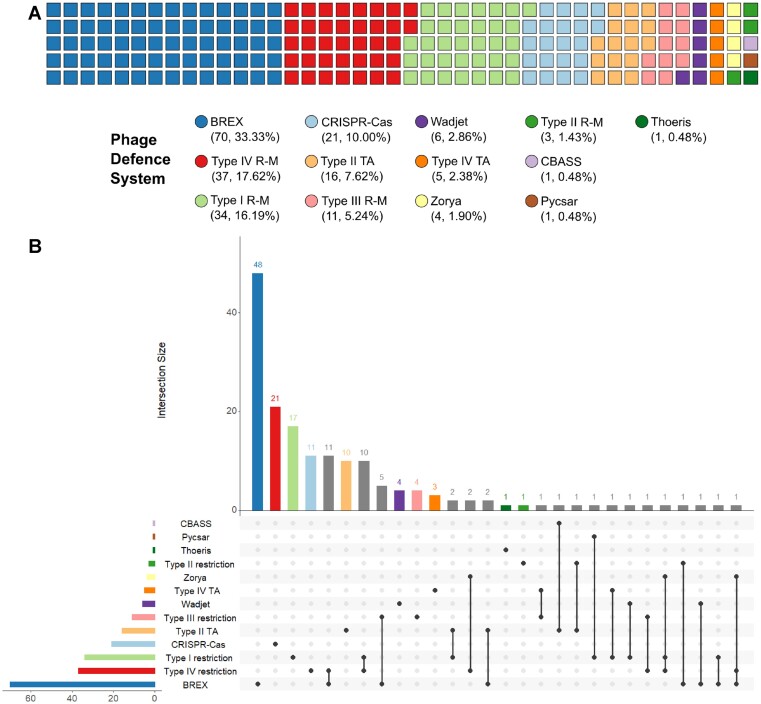
Figure 8.
BrxR is associated with a variety of different phage defence systems. (A) Waffle chart showing the distribution of defence systems identified downstream of brxR, coloured to show the general class of system identified. (B) UpSet plot showing the co-occurrence of phage defence systems downstream of brxR. Set and intersection bars are coloured by single defence systems, with overlapping intersections in grey. The matrix indicates overlapping set intersections, with set size as the horizontal bar chart, and the vertical bar chart showing intersection size (the number of times any systems are found in combination).

