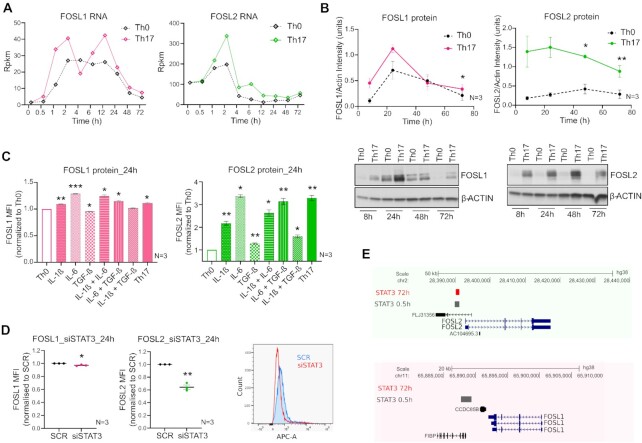
Figure 1.
Expression of FOS-like proteins during human Th17 differentiation. (A) Rpkm values are plotted for FOSL1 (left) and FOSL2 (right) RNA at different time points of activation (Th0) or Th17-differentiation, using our published RNA-seq data (8). (B) Immunoblot images (lower panel) show FOSL1 (left) and FOSL2 (right) protein levels in Th0 and Th17-polarizing cells, over a time-course. Actin was used as loading control. Blots from three biological replicates were quantified using ImageJ and FOSL intensity values (normalized to actin) were plotted as a line graph in the above panel. (C) Flow cytometry analysis of FOSL1 (left) and FOSL2 (right) expression in naive CD4+ T-cells cultured for 24 h, under conditions of activation (Th0), Th17-differentiation, or activation in presence of the Th17-cytokines (used either alone or in combination). Bar plot shows median fluorescence intensity (MFI) values normalized to Th0, for three biological replicates. Statistical significance was calculated by comparing each condition to Th0. (D) Flow cytometry analysis of FOSL1 (left) and FOSL2 (right) protein levels in non-targeting (SCR) versus STAT3 KD cells, at 24 h of Th17 polarization. Graph shows MFI values normalized to SCR for three biological replicates. Adjoining histogram (flow cytometry analysis) confirms the depletion of STAT3 protein levels in the KD cells at 24 h of Th17 polarization. All graphs in panels B–D show mean ± standard error of the mean (SEM). Statistical significance is calculated using two-tailed Student's t test (*p < 0.05; **p < 0.01, ***p < 0.001). (E) UCSC genome browser snapshots indicate the binding of STAT3 over the promoter of FOSL2 (above panel) and not FOSL1 (below panel), in Th17 cells cultured for 0.5 and 72 h. Figures were derived using bed files of STAT3 ChIP-seq data from our published study (43).

