Figure 2.
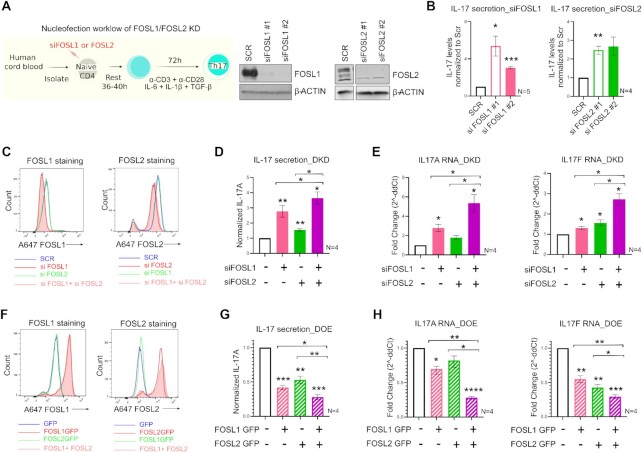
FOSL1 and FOSL2 negatively regulate IL-17 expression. (A) Nucleofection workflow for FOSL1/FOSL2 knockdown (KD) is shown in the left panel. Naive CD4+ T-cells were treated with two different siRNAs targeting FOSL1 or FOSL2. Cells were rested at 37°C in RPMI-medium, and further cultured under Th17-polarizing conditions. At 24 h post differentiation, knockdown was analysed using immunoblotting (right panel). Representative blots for three biological replicates are shown. (B) ELISA was used to estimate IL-17A secretion in supernatants of FOSL1 (left) and FOSL2-silenced (right) Th17 cells, at 72 h of polarization. Values were first normalized for cell count (live), and then normalized to SCR control. Data represents four or five biological replicates, as indicated. (C) Naive CD4+ T-cells were silenced for FOSL1, FOSL2 or both factors in parallel (double KD; DKD) and cultured under Th17-polarizing conditions for 24 h. Total FOSL1 (left) or FOSL2 (right) protein was stained (Alexa-647) and analysed by flow cytometry. Representative histograms for four biological replicates are shown. (D) Bar plot shows ELISA results for secreted IL-17A levels in supernatants of FOSL KD/DKD Th17 cells, at 72 h of polarization. Values were first normalized for cell count (live), and then normalized to SCR control. Data represents four biological replicates. (E) qRT-PCR analysis for measurement of IL-17A (left) and IL-17F (right) RNA levels in FOSL KD/DKD Th17 cells (72 h). Fold-change normalized to the control was plotted for four biological replicates. (F) Naive CD4+ T-cells were treated with in-vitro transcribed GFP-FOSL1 RNA, GFP-FOSL2 RNA or both (double OE; DOE). GFP RNA was used as nucleofection control. After resting the cells for 18–20 h, total FOSL1 (left) or FOSL2 (right) protein was stained (Alexa-647) and analysed by flow cytometry. Representative histograms for four biological replicates are shown. (G, H) Graphs show IL-17 secretion (panel G) and IL-17A/F RNA expression (panel H) in FOSL OE/DOE Th17 cells at 72 h of polarization, as assessed by ELISA and qRT-PCR analyses, respectively. ELISA values were first normalized for cell count (live), and then normalized to GFP control. Panel H depicts fold change normalized to control. Data represents four biological replicates. Plots in figures B, D, E, G, H show mean ± SEM. Statistical significance is calculated using two-tailed Student's t test (*p< 0.05, **p < 0.01, ***p < 0.001, ****p< 0.0001).

