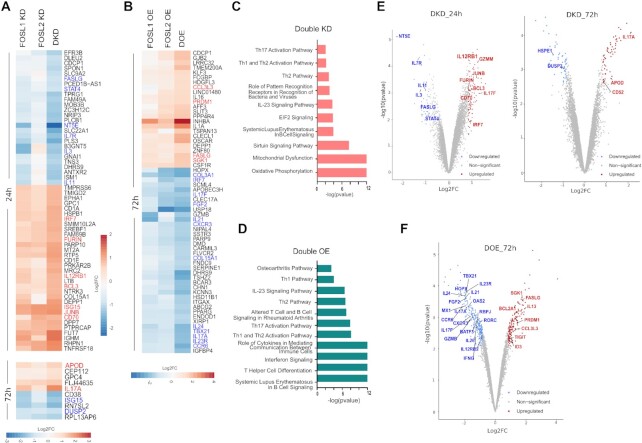
Figure 3.
Transcriptional targets co-regulated by FOSL1 and FOSL2. (A, B) Heatmap in panel A shows the DE genes that are more profoundly altered in FOSL DKD Th17 cells, as compared to the single KD controls, at 24 h (above) and 72 h (below) of polarization. Panel B depicts the DE genes that show enhanced changes in FOSL DOE Th17 cells, as compared to the single OE controls, at 72 h of polarization. Fold-change (FC) was calculated relative to the respective control conditions (i.e. SCR or GFP). The FDR filtered (≤0.1) DE genes with |FC| ≥ 1.8 in DKD, and |FC| ≥ 2 in DOE, are included in the corresponding heatmaps. Th17-relevant, upregulated genes are depicted in red, and the downregulated ones are in blue. (C, D) Ingenuity pathway analysis (IPA) was used to identify signaling pathways that are altered upon FOSL DKD (panel C) or DOE (panel D). The top pathways related to T-cells and immune signaling are selectively shown. (E, F) Genome-wide expression analysis of FOSL DKD and DOE Th17 cells. Volcano plots in panel E highlight the Th17-associated transcripts that are differentially expressed upon co-depletion of FOSL1 and FOSL2, at 24 h (left) and 72 h (right) of Th17 polarization. Panel F shows the Th17-associated genes that are differentially expressed upon parallel over-expression of FOSL1 and FOSL2, at 72 h of Th17 polarization. Targets with FDR ≤ 0.1 and |FC| ≥ 1.8 have been plotted. Upregulated genes are in red, and the downregulated ones are in blue (for extended list of DKD and DOE targets, refer to Supplementary Figure S3A, B).

