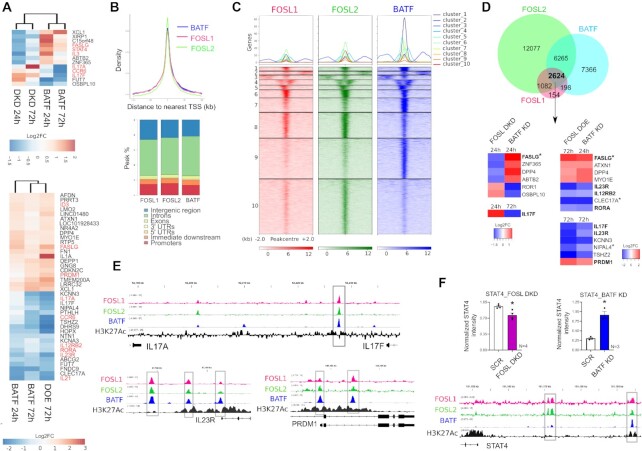
Figure 6.
Comparing transcriptional targets and genomic binding sites of FOSL proteins with BATF. (A) Heatmap on the top shows logarithmic FC values for the DE genes that show opposite expression changes in FOSL DKD and BATF KD Th17 cells, at the indicated time points of differentiation. Heatmap in the bottom panel depicts the DE genes that show similar expression changes in FOSL DOE and BATF KD Th17 cells. Th17-related genes are highlighted in red. (B) ChIP-seq profiles of FOSL1, FOSL2 and BATF in Th17 cells. Graph (above) shows the overlay between the peak distribution profiles of the three TFs. Bar plot (below) depicts peak-annotation results for their identified binding sites. (C) Heatmap with k-means clustering shows the ChIP-seq signal intensities ± 2-kb around the centers of the genomic-binding regions of FOSL1, FOSL2 and BATF. (D) Venn diagram shows an overlap between the genomic binding sites of FOSL1, FOSL2 and BATF (overlap represents peaks sharing 200 bp or more). Adjoining heatmap depicts Log2FC values for the gene targets that are co-bound and oppositely regulated by FOSL proteins and BATF, at the given time points of Th17 differentiation. Genes showing shared occupancy of the three factors over promoter regions have been marked (*asterisk). Th17-related targets are highlighted. (E) IGV track snapshots illustrate the co-localization of FOSL1, FOSL2 and BATF over selected Th17-linked genes. The profile of H3K27ac histone mark around the shared binding sites of the three factors is shown. (F) Bar plot depicts immunoblot-based expression analysis of STAT4 in FOSL DKD (left) and BATF KD (right) Th17 cells, cultured for 72 h. Data shows mean ± SEM for three or four biological replicates, as indicated. Statistical significance is calculated using two-tailed Student's t test (*p < 0.05). Adjoining IGV track shows the binding overlap of FOSL1, FOSL2 and BATF, flanked by H3K27ac marks near the STAT4 locus.

