Figure 6.
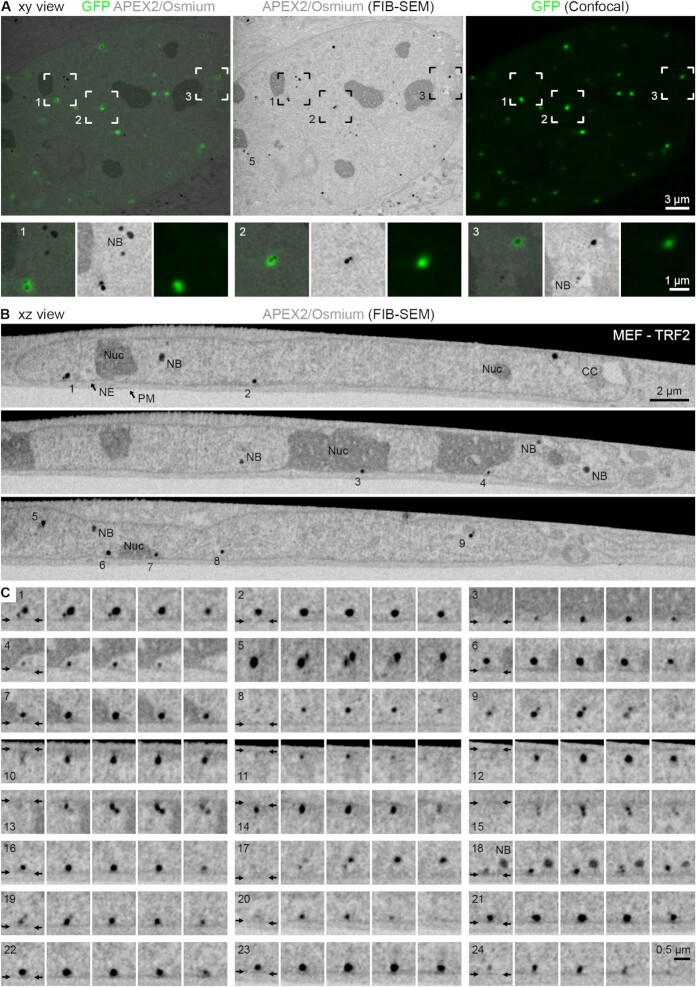
FIB-SEM reveals the organization of telomeres in the 3D volume of the nucleus. (A) Xy view. Left: Overlay image of the APEX2/osmium signals (grey, average intensity projection of five SEM slices with a thickness of 135 nm) and the corresponding light optical confocal section (GFP signals, green). Middle and right: Corresponding APEX2/osmium signals (middle) and GFP signals (right) only of the overlay image. Telomere 5 is the same as in panels (B) and (C). The boxed areas are magnified below; for each of the three examples from left to right: overlay, APEX2/osmium signals alone, GFP signals alone. NB = nuclear body. (B, C) Xz view. APEX2/osmium signals. The numbered telomeres in the selected slices in panel (B) are magnified in panel (C) along with further examples; five consecutive micrographs are shown for each telomere. NE = nuclear envelope; position indicated by the small arrows. PM = plasma membrane. NB = nuclear body. Nuc = nucleolus. CC = chromocentre.

