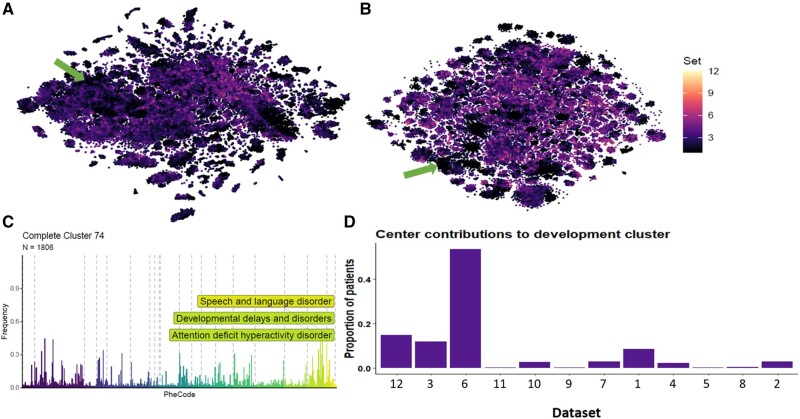
Figure 2.
The effects of dataset harmonization. Overview showing (A) the t-SNE embedding of all 102,880 individuals colored for LISI score prior to harmonization with Harmony and (B) the same post-harmonization, as well as (C) an example showing that relevant structure is maintained by (D) not forcing dataset mixing where local structure is best represented by a small selection of datasets (developmental disorders in children’s hospitals, green arrows in A and B).

