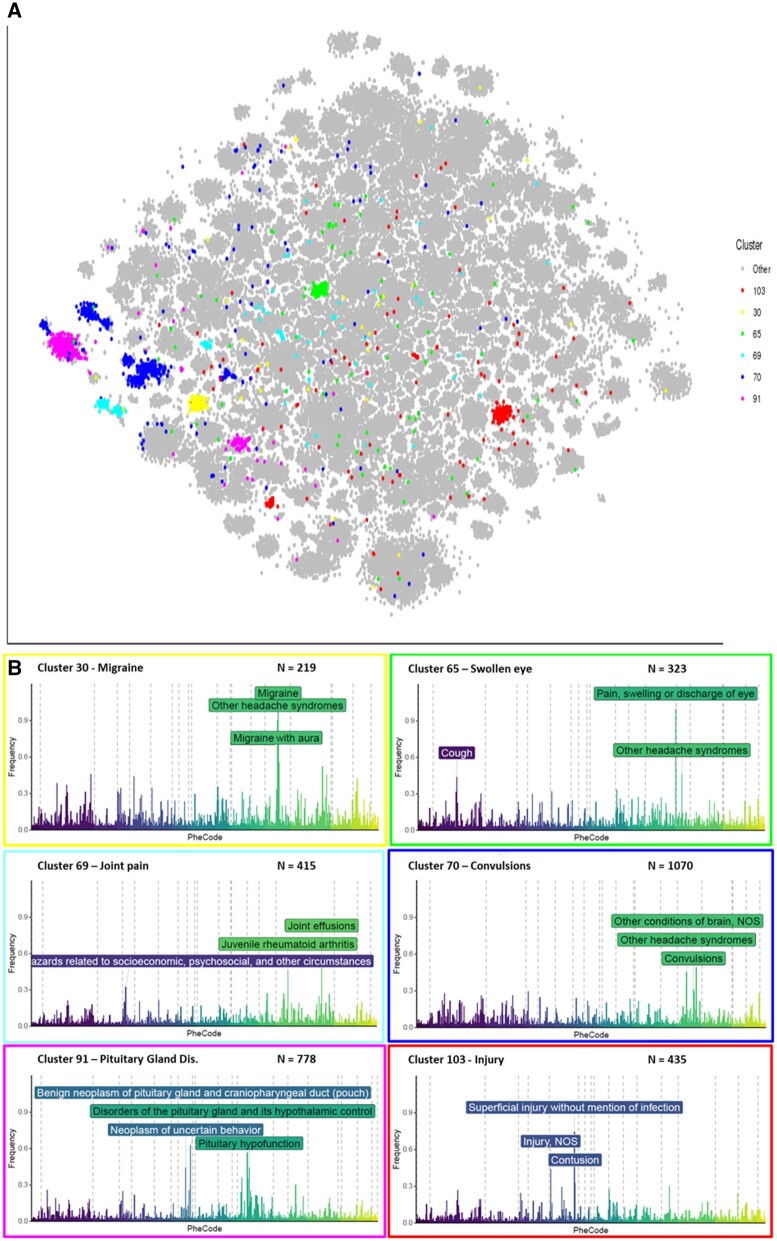
Figure 5.
Overview of 6 headache subgroups. N is the number of patients located in the cluster. Location of clusters characterized by “other headache syndromes” in t-SNE space (A) and their corresponding phenotypic profiles (B). The frequency (y-axis) reflects the proportion of total cluster members with each RSP filtered top 500 code (x-axis). The graphs summarize the data from all cohorts together. For complete PheSpec compositions, see Supplementary Figure S5.

