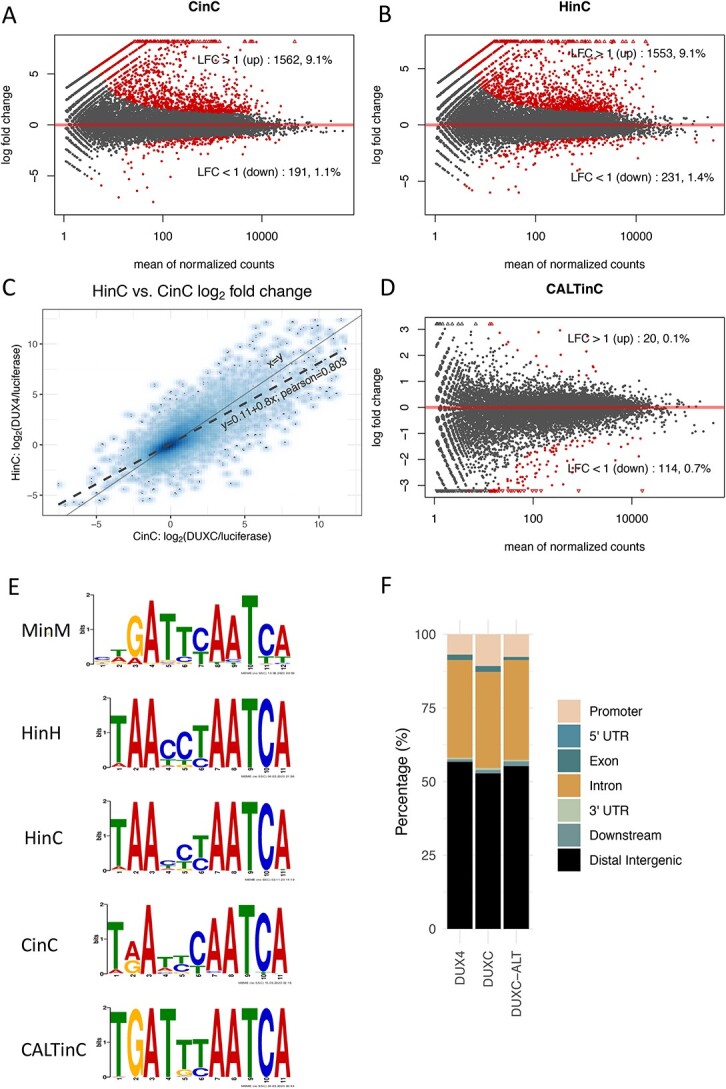
Figure 2.

Transcriptome and DNA binding sites of DUXC, DUX4 and DUXC-ALT in canine skeletal muscle cells. (A) A MA plot of gene expression in canine muscle cells expressing DUXC (CinC) compared with the control luciferase expression vector. The x axis is the mean of normalized counts on each gene between two conditions (A value), and the y axis is the  fold change (M value). Red dots represent the differentially expressed genes with adjusted P-values < 0.05 corresponding to the hypothesis
  . (B) Similar to (A) but with comparison of the cells expressing DUX4 (HinC). (C) A smoothed scatter plot to show the linear relationship of the
  fold change between the CinC (x axis) and HinC (y axis) comparison models. The Pearson correlation between the two sets of
  fold change is 0.803. The gray dashed line is the linear regression,
  , and the solid gray line is
  . (D) Similar to (A) but with the comparison of the cells expressing DUXC-ALT (CALTinC). (E) De novo motif discovery determined binding motifs for mouse Dux expressed in mouse myoblasts (MinM), human DUX4 expressed in human myoblasts (HinH), human DUX4 expressed in canine myoblasts (HinC), and canine DUXC and DUXC-ALT expressed in canine myoblasts (CinC and CALTinC). The HinH and MinM binding motifs were derived from published ChIP-seq data GSE33838 and GSE87279, respectively. (F) Genomic distribution of ChIP-seq peaks for DUX4, DUXC and DUXC-ALT.
