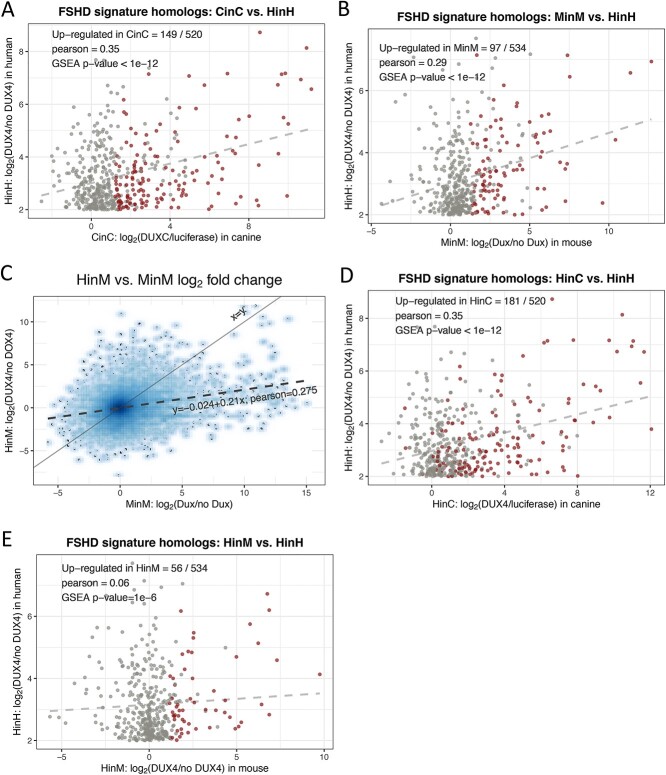
Figure 3.
Comparisons to the FSHD transcriptome. (A) A scatter plot of  fold change of the 520 human-canine homologs of FSHD signature genes in the HinH and CinC transcriptome. Red dots indicate that the homologs are also upregulated in CinC. (B) Same as (A), but with the 534 human-mouse homologs in the HinH and MinM transcriptome, red dots indicate upregulation in MinM. (C) A smooth scatter plot to show the relationship of
  fold change between the HinH and MinM transcriptome. The Pearson correlation between these two sets is 0.275. Gray dashed line presents the linear regression line,
  and the solid is
  (D) Same as (A), but with 520 human-canine homologs in the cross-species HinC and HinH transcription, and red dots indicate upregulation in HinC. (E) Same as (A), but with 534 human-mouse homologs in the HinH and cross-species HinM transcriptome, and red dots indicate upregulation inHinM.

