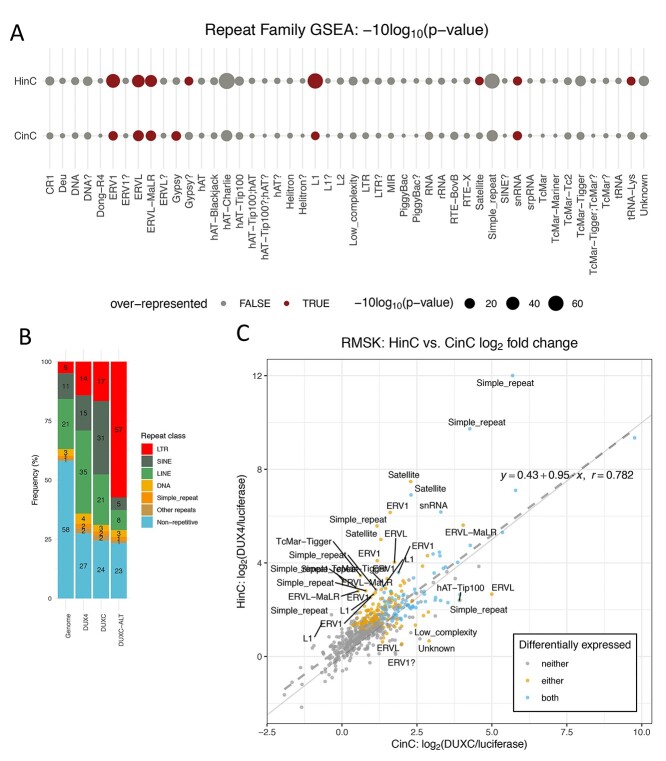
Figure 4.
Repeat element transcriptome shows retrotransposon activation by DUXC in canine skeletal muscle cells. (A) Repeat family enrichment analysis for DUX4 (HinC) and DUXC (CinC) expressed in canine skeletal muscle cells. Each dot represents the GSEA statistics for each repeat family with size reflecting the scaled P-value, −10log2 (P-value). Red dots indicate the family is over-represented with P-values < 0.1 and the number of significant genes in the family is higher than expected. (B) The distribution of peaks of DUX4, DUXC, DUXC-ALT transcription factors in classes of repeat elements versus the distribution of the repeat elements in the whole genome. (C) A scatter plot to show the relationship of  fold change of the HinC and CinC transcriptome. Each dot represents a repeat element, and the color coding presents the differential expression status. Dashed line is the linear regression line
  , whereas the solid is
  . A repeat element’s family name is labeled if the difference between two models is >1.5.

