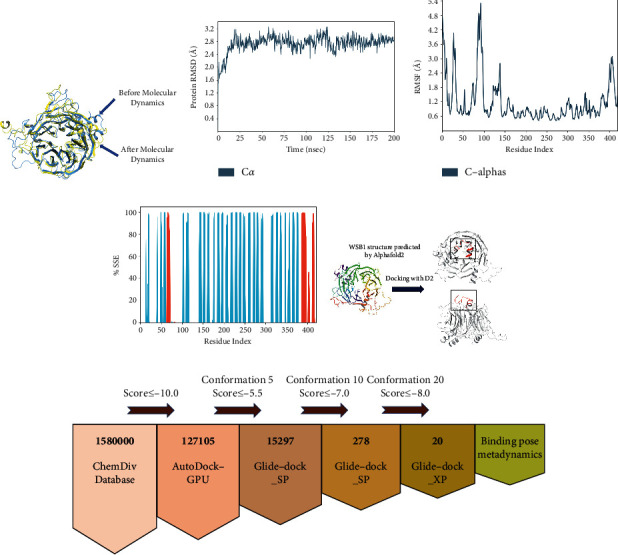
Figure 1.

Molecular dynamics simulation results of WSB1. (a) The RMSD plot of a protein. (b) The RMSF plot of a protein 1. The blue line indicates the simulation results of a protein. (c) The SSF plot of a protein. (e) Docking results of the WSB1 protein with D2. The structure of the WSB1 protein is predicted by using AlphaFold2. There are two forms of WSB1 protein docking with D2, and the red part in the black box is D2. (f) The workflow of virtual screening.
