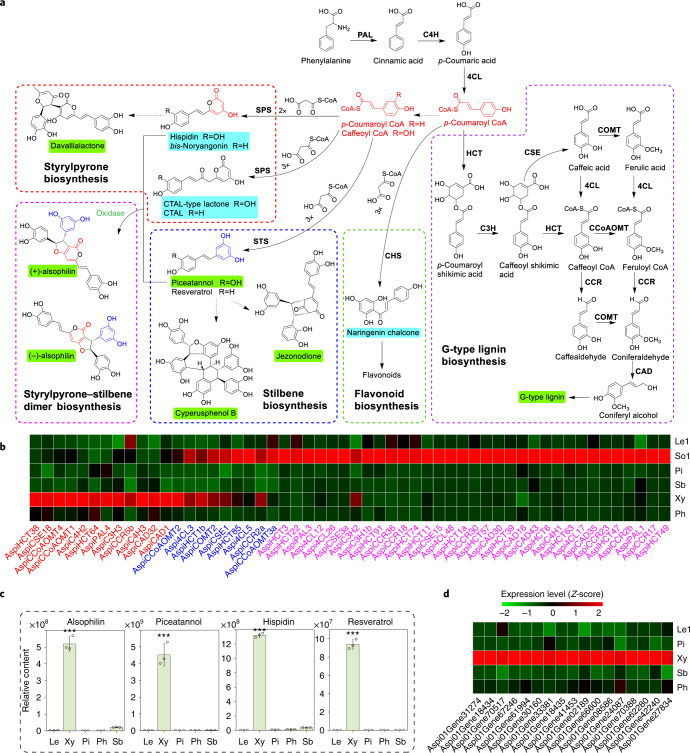
Fig. 3. Biosynthesis of phenylpropanoid-based metabolites in A. spinulosa.
a, Biosynthetic pathways of lignin, flavonoids, stilbene, styrylpyrone and alsophilin. The metabolites shaded in green are identified in our metabolomic characterizations. The metabolites shaded in blue are products in the enzyme assays. PAL, phenylalanine ammonia-lyase; C4H, cinnamate-4-hydroxylase; 4CL, 4-coumarate:coenzyme A ligase; HCT, p-hydroxycinnamoyl-CoA:quinate shikimate p-hydroxycinnamoyltransferase; CCR, cinnamoyl CoA reductase; C3H, 4-coumarate 3-hydroxylase, CAD, cinnamyl alcohol dehydrogenase; CSE, caffeoyl shikimate esterase; COMT, caffeic acid/5-hydroxyconiferaldehyde O-methyltransferase; CCoAOMT, caffeoyl-CoA O-methyltransferase. b, Heat map showing gene expression profiles of monolignol biosynthetic pathway genes in xylem, phloem, sclerenchymatic belt, pith, sorus stage 1 and leaf stage 1. Genes highlighted in red and pink are significantly upregulated in xylem and sorus, respectively, and genes highlighted in blue are significantly upregulated in both xylem and sorus. c, Relative content of alsophilin, piceatannol, hispidin and resveratrol in leaf, xylem, phloem, pith and sclerenchymatic belt of A. spinulosa, determined by ultra performance liquid chromatography-mass spectrometry (UPLC–MS). The asterisks indicate the significance (***P < 0.001, two-sided Student’s t-test) of alsophilin content in Xy compared with the other four tissues. The values are the means ± s.d. of three independent experiments. d, Heat map showing the gene profiles of 17 oxidase genes upregulated in xylem. The FPKM values were normalized using the Z-score method. So1, sorus stage 1; Le1, leaf stage 1.

